Topic

Chart of the Day

Coverage, charts, video and research on Chart of the Day for universal owners.

Latest in Chart of the Day
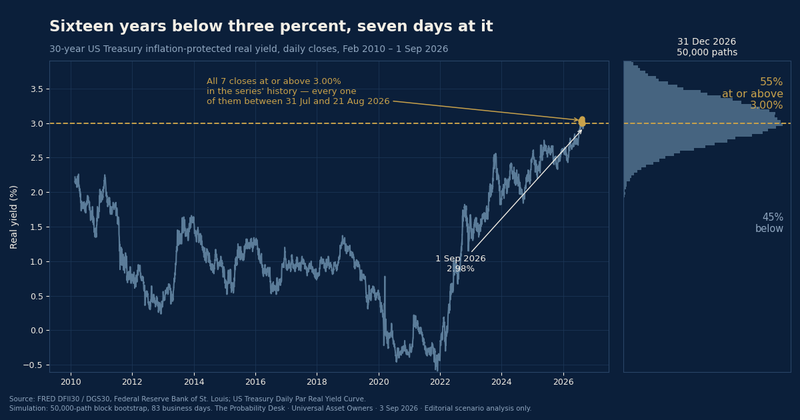
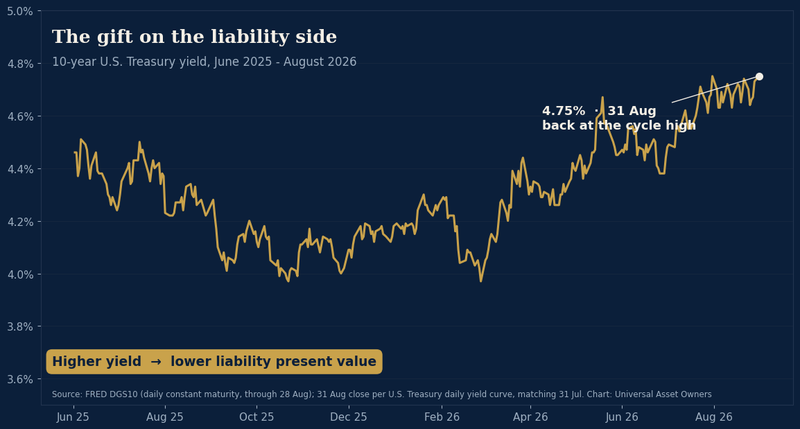
Chart of the Day — Sixteen years below three percent, seven days at it
The Probability Desk

PD Chart of the Day — 2026-09-03

The 30-year US Treasury inflation-protected real yield closed at 2.98% on 1 September 2026. In the 4,136 trading days since that series began in February 2010, it has closed at or above 3.00% on exactly seven — and all seven fell between 31 July and 21 August this year. The gold dots on the left pan

UAO Editorial · Sep 3, 2026
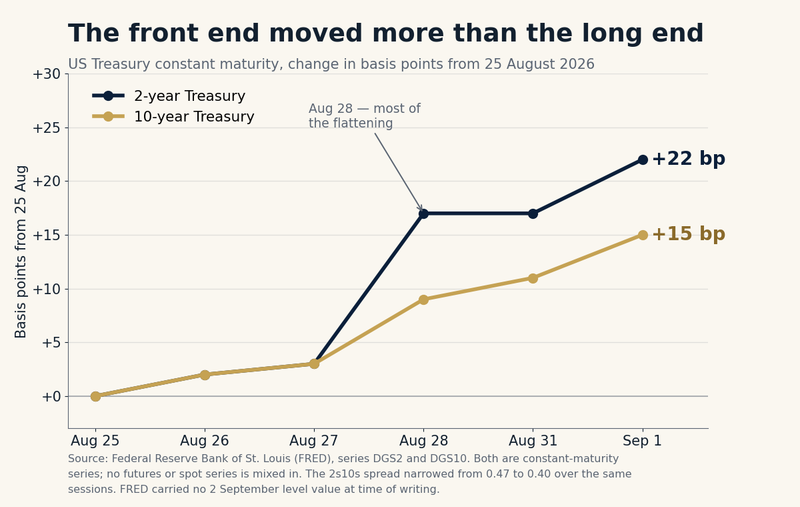
US Treasury 2-year and 10-year, change in basis points from 25 August 2026
Chart of the Day

US Treasury 2-year and 10-year, change in basis points from 25 August 2026

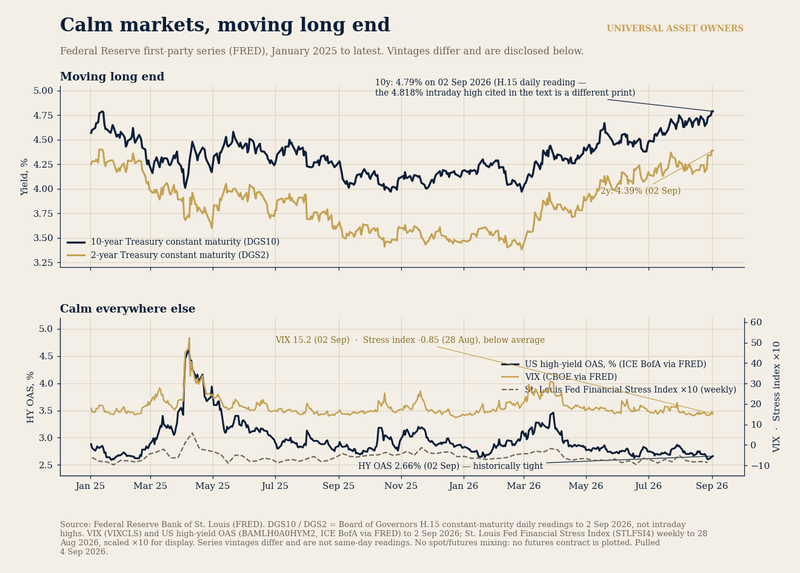
The 2-year rose 22 basis points and the 10-year 15 across six sessions to 1 September; the spread narrowed to 0.40. Both are Federal Reserve constant-maturity series — no futures or spot series is mixed in. FRED carried no 2 September level value at time of writing.

UAO Editorial · Sep 3, 2026
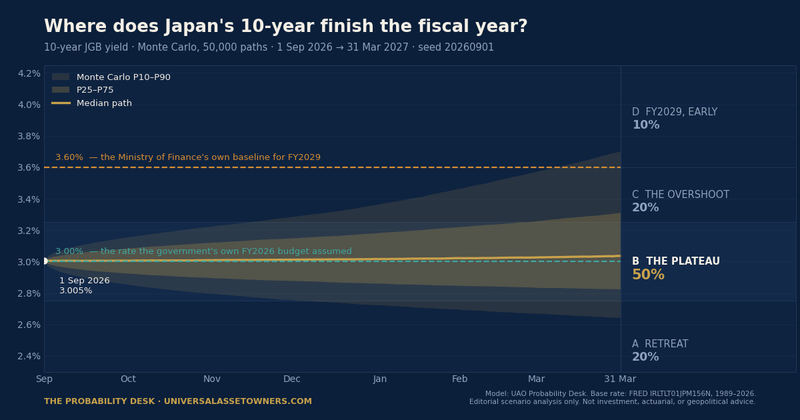
Chart of the Day: the two lines Tokyo's budget already drew
The Probability Desk

PD Chart of the Day — 2026-09-01

Japan's 10-year hit 3.000% on Tuesday — the exact rate the government's own fiscal 2026 budget assumed. The Ministry has since raised its fiscal 2027 costing rate to 3.8%.

UAO Editorial · Sep 1, 2026
One market number moves our Fed call more than our whole model does
The Probability Desk

PD Chart of the Day — 2026-08-31

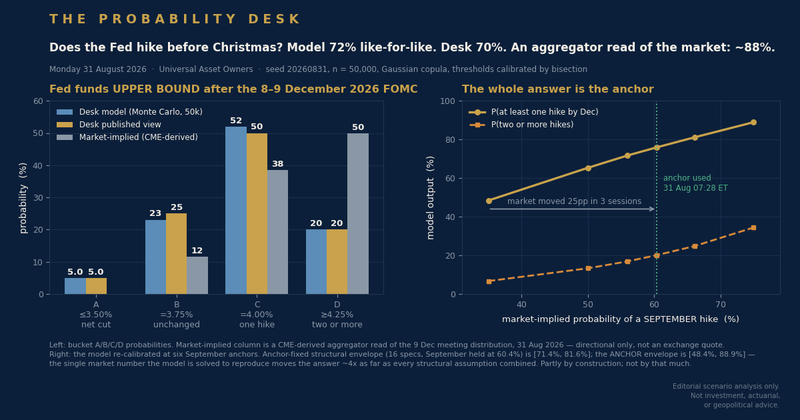
Left: where the federal funds target range lands after the 8–9 December FOMC. The Desk model puts 51.9 percent on exactly one increase and 20.1 percent on two or more — 71.98 percent between them. Our published view is 5 / 25 / 50 / 20, a 70 percent chance of at least one hike, two points

UAO Editorial · Aug 31, 2026
Chart of the day — 2026-08-28
Chart of the Day

Chart of the day — 2026-08-28

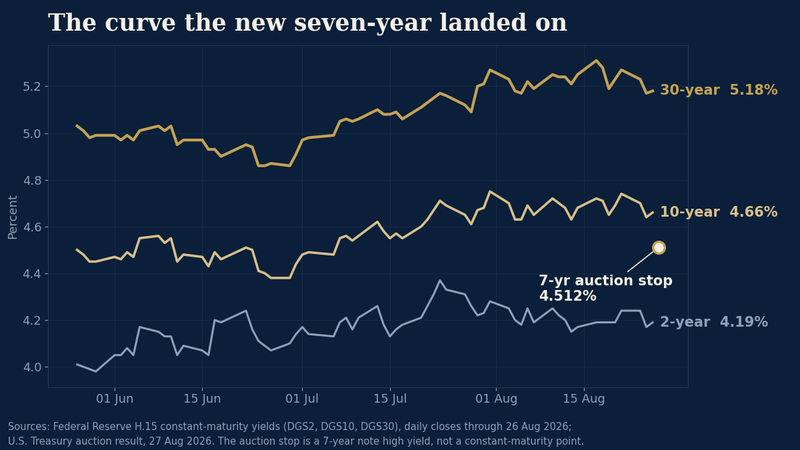
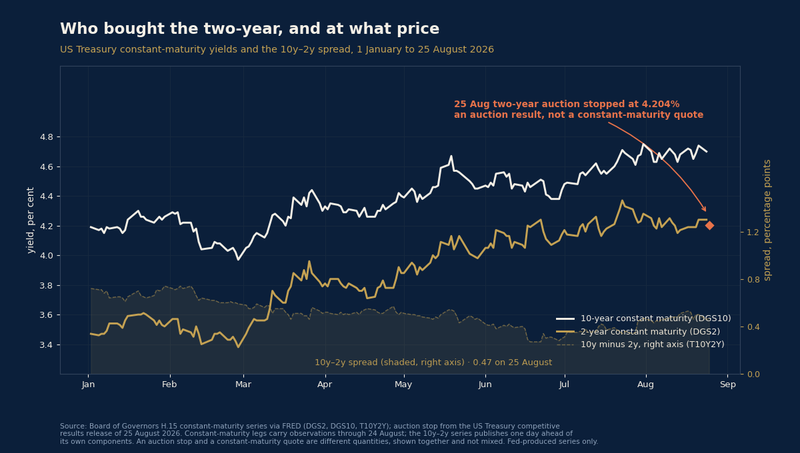
Thursday’s seven-year high yield, 4.512 percent, against the four-week bill at 3.650 percent and the eight-week bill at 3.670 percent. One is a coupon on a note. The other two are discount rates on bills.

UAO Editorial · Aug 28, 2026
One line says corridor. The other says five ships a day.
The Probability Desk

PD Chart of the Day — 2026-08-26

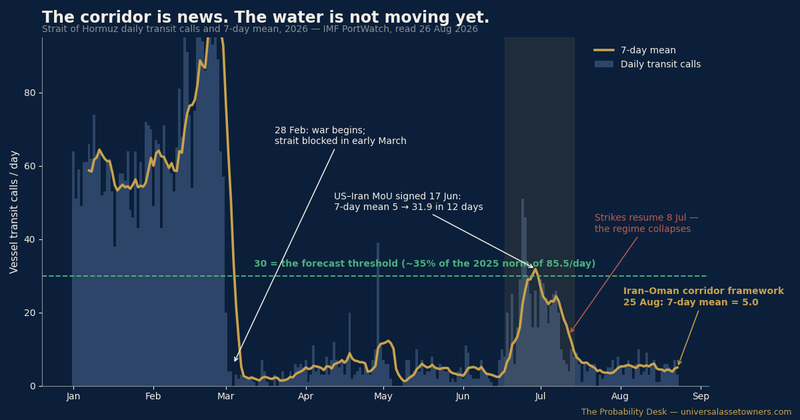
Brent fell three sessions on the Iran–Oman corridor framework, yet the strait’s own feed still prints 5 transits a day against a 2025 norm of 85.5. In June a real framework moved that line from 5 to 31.9 in twelve days. The Desk weights a 45% chance the 7-day mean prints 30 by 31 March 2027.

UAO Editorial · Aug 26, 2026
Chart of the day — 2026-08-26
Chart of the Day

Chart of the day — 2026-08-26

Sources: Tungsten West plc, “Strategic Investment by the UK Government NWF”, RNS, 25 August 2026;

UAO Editorial · Aug 26, 2026
The Daily Brief

The morning briefing for the people who allocate long-horizon capital.

Research, charts, video and podcast analysis for the institutions investing at the scale of the world.