Chart of the Day

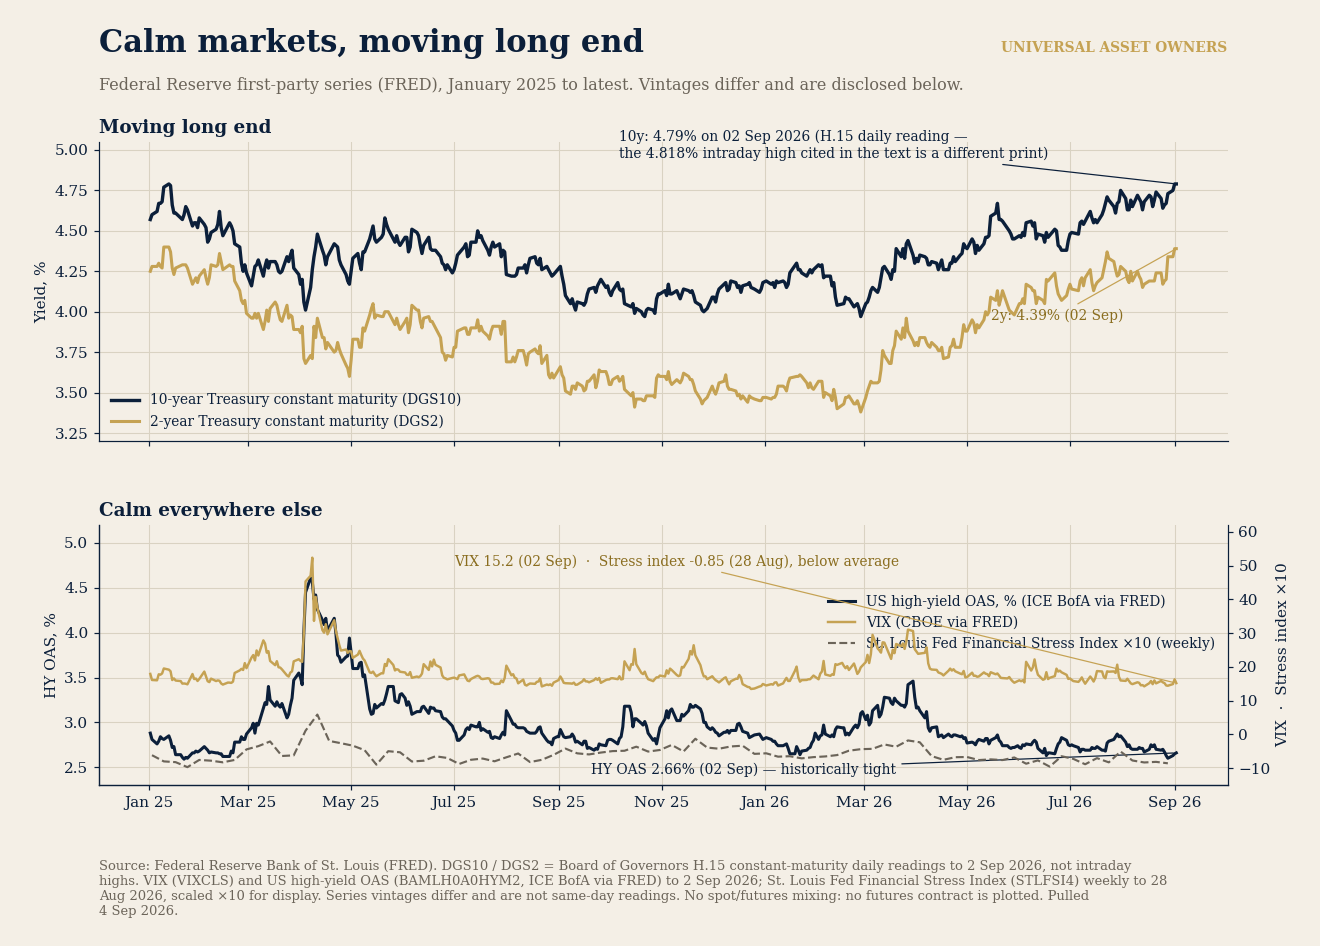
10-year and 2-year Treasury yields, VIX, high-yield OAS and the St. Louis Fed Financial Stress Index

10-year and 2-year Treasury constant-maturity yields (Board of Governors H.15 daily readings, not intraday highs), VIX (CBOE via FRED) and US high-yield OAS (ICE BofA via FRED) to 2 September 2026; St. Louis Fed Financial Stress Index (weekly) to 28 August 2026, scaled ×10 for display. Ser

10-year and 2-year Treasury yields, VIX, high-yield OAS and the St. Louis Fed Financial Stress Index
Chart of the day
Source: Federal Reserve Bank of St. Louis (FRED), pulled 4 September 2026.

10-year and 2-year Treasury constant-maturity yields (Board of Governors H.15 daily readings, not intraday highs), VIX (CBOE via FRED) and US high-yield OAS (ICE BofA via FRED) to 2 September 2026; St. Louis Fed Financial Stress Index (weekly) to 28 August 2026, scaled ×10 for display. Series vintages differ and are not same-day readings. No futures contract is plotted.

The Daily Brief

The morning briefing for the people who allocate long-horizon capital.

Research, charts, video and podcast analysis for the institutions investing at the scale of the world.

Universal Asset Owners
Get the daily brief · Search the Top 100 Registry · SWF, pension & family office jobs