Why it matters
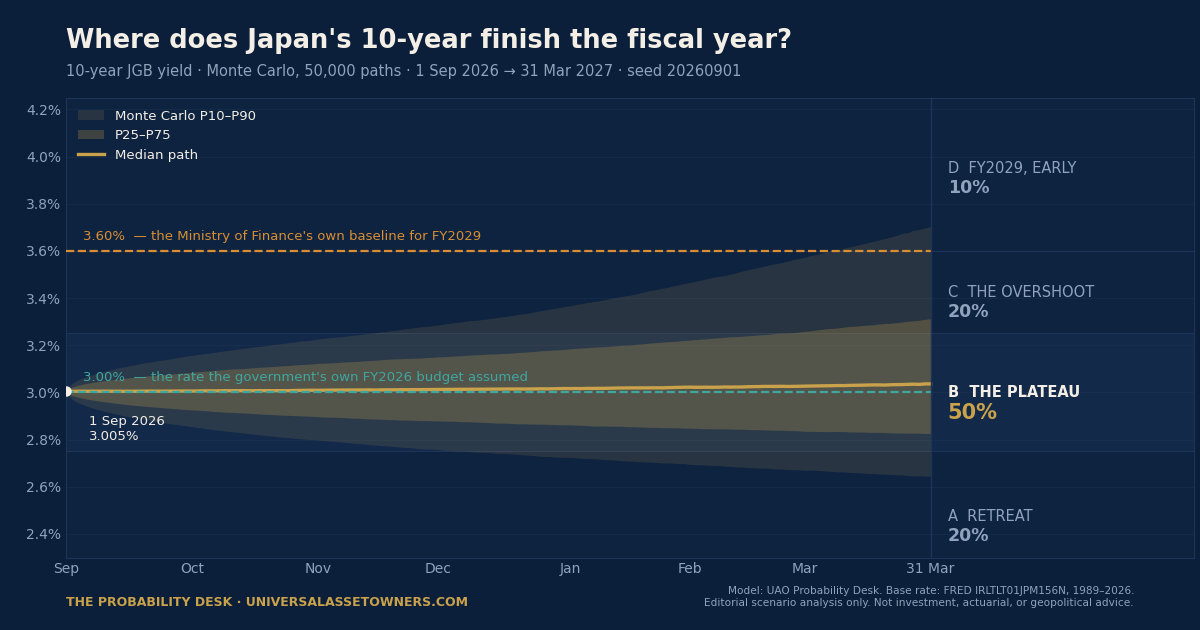
Japan's 10-year government bond yield reached 3.000% on Tuesday, the first 3-handle since 1996. The number is not arbitrary. It is the long-term interest rate the government itself assumed when it costed debt service in the fiscal 2026 budget — the teal line on this chart. The amber line, 3.60%, is the Ministry of Finance's own baseline projection for the 10-year in fiscal 2029, the level at which debt-servicing costs rise to ¥41 trillion against the ¥31 trillion currently provisioned.
There is a third government number that is not on the chart, and it changes how you read the other two. In late August the Ministry raised the rate it uses to cost next year's debt service to 3.8% for fiscal 2027, from 3.0% — a 29-year high — and requested a record ¥36.64 trillion for interest. That 3.8% is not a forecast; the convention is to add roughly 1.1 percentage points to prevailing yields as a buffer against sudden spikes. So the Ministry has provisioned above the amber line while projecting below it.
The fan is the Probability Desk's Monte Carlo — 50,000 paths, seed 20260901 — for where the 10-year sits on the last JGB business day of Japan's fiscal year, 31 March 2027, as published by the Ministry of Finance. We weight the base case, a plateau within 25 basis points of the government's own budget assumption, at 50%, and the move above the Ministry's 2029 projection at 10%. Which puts the Desk below the fiscal authority's own costing rate.
The chart's real content is the gap between the two dashed lines. That gap is Japan's fiscal plan, drawn to scale, with a probability distribution laid over it.
Read the full scenario
Editorial scenario analysis only. Not investment, actuarial, or geopolitical advice.
Continue the briefing. Read the daily brief · watch the daily video briefing · listen to The Universal Owner · view the chart of the day.
Produced and edited by the UAO editorial desk. Not investment advice.