The Probability Desk — Tuesday, 1 September 2026
Desk view, in one paragraph
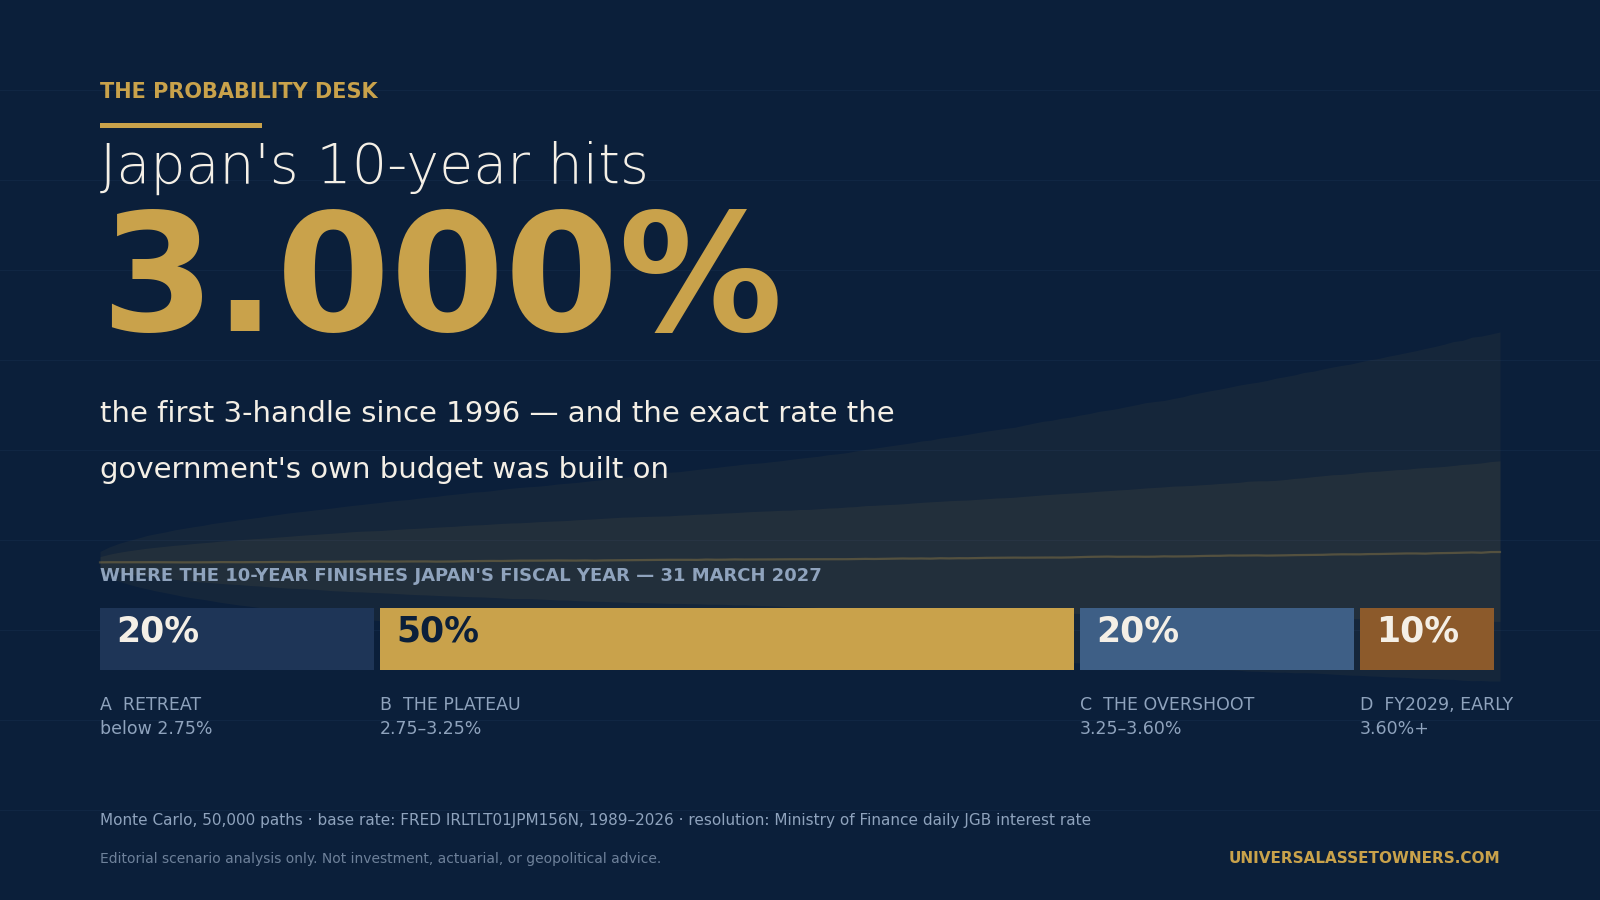
Tokyo printed the number its own budget was built on. The 10-year Japanese government bond yield reached 3.000% on Tuesday — the first time since 1996, and precisely the long-term interest rate the government assumed when it calculated debt-servicing costs for the fiscal 2026 budget. The reflex reading is that Japan has entered a fiscal crisis. The Desk's reading is narrower and, we think, more useful: this is a term-premium event, not an inflation event — headline and core inflation are both below the Bank of Japan's target — and the 10-year auction held on the same day cleared with robust demand, because at 3% a JGB finally out-earns what Japanese banks pay for deposits and what Japanese life insurers owe their policyholders. That is simultaneously the thing that caps the yield and the thing that pulls Japanese capital home from every other bond market on earth. We weight the fiscal-year-end level: 20% below 2.75% · 50% between 2.75% and 3.25% · 20% between 3.25% and 3.60% · 10% at or above 3.60%. Which places the Desk below the Ministry of Finance's own arithmetic — it has already lifted the rate it uses to cost next year's debt service to 3.8%. And the model's most uncomfortable finding is that re-weighting the September Bank of Japan meeting on its own — the event the entire market is watching — moves that distribution almost not at all.
1. The Trigger
Tuesday, 1 September 2026, Tokyo. The yield on Japan's benchmark 10-year government bond reached 3.000% in the afternoon session and edged to 3.005% — the first 3-handle since 1996. The move was not isolated to the benchmark. On the same session the 5-year touched a record 2.265%, the 2-year reached a 31-year peak of 1.81%, the 20-year touched 3.885%, a level not seen since 1996, and the 30-year was poised for a record closing high of 4.18% Reuters, Rocky Swift and Kevin Buckland, Tokyo, 1 September 2026. The 10-year yield, Reuters notes, has more than tripled in two years.
The proximate cause is dated and specific. On Monday 31 August, Japan's ministries and agencies submitted a record ¥143 trillion (about $890bn) in initial budget requests for fiscal 2027 — the largest on record. The Ministry of Health, Labour and Welfare accounted for a record ¥36.58trn, the Defense Ministry a record ¥8.89trn, and the Ministry of Economy, Trade and Industry sought roughly ¥6.3trn for artificial intelligence, semiconductors and robotics. Prime Minister Sanae Takaichi's government declined to set request ceilings for a new investment category covering growth and national security — a departure from previous budget-drafting practice. Requests into that uncapped category alone exceeded ¥10 trillion Kyodo, via Japan Today, 1 September 2026. Japan Today / Kyodo, 31 August 2026.
And the Ministry of Finance had already moved. Ahead of that submission, it raised the assumed long-term interest rate used to cost debt service to 3.8% for fiscal 2027, from 3.0% for fiscal 2026 — a 29-year high — and requested a record ¥36,638.6 billion (¥36.64 trillion) for debt servicing, roughly ¥5.4 trillion more than the fiscal 2026 initial budget Jiji, via Nippon.com, 21 August 2026. Jiji, via Nippon.com, 25 August 2026. The Japan Times, 22 August 2026.
That 3.8% is not a forecast and should not be read as one. The assumed rate is set by adding roughly 1.1 percentage points to prevailing yields as a buffer against sudden spikes. When the Ministry set it in late August, the market was near 2.7%. Hold that convention: it is the single most useful piece of arithmetic in this edition, and we return to it in §6.
Two dating notes, because they matter to anyone checking us. Reuters puts the last 3% print in September 1996; Kyodo puts it in October 1996. We have not reconciled the two and report both. Second, the Ministry of Finance's own published daily JGB interest rate for 1 September is the arbiter of record for this edition's forecast question; the intraday figures above are Reuters' and Kyodo's.
Finance Minister Satsuki Katayama declined to comment when asked about the benchmark approaching 3%, after the first day of the G20 finance leaders' meeting on Monday.
2. The Forecast Question
Where will the 10-year Japanese government bond yield stand at the close of Japan's fiscal year 2026 — the last JGB business day on or before 31 March 2027?
Resolution source, sole arbiter: the Japanese Ministry of Finance's published daily Interest Rate table for Japanese Government Bonds, 10-year column, as first published, for the final JGB business day on or before 31 March 2027. No judgement is required to grade this.
Buckets — mutually exclusive, collectively exhaustive:
| Bucket | Range | Why this boundary | |
|---|---|---|---|
| A | The Retreat | below 2.75% | Below the level at which the 1 September auction cleared domestic liability costs |
| B | The Plateau | 2.75% to below 3.25% | Straddles the government's own fiscal 2026 budget assumption of 3% |
| C | The Overshoot | 3.25% to below 3.60% | Above the budget assumption, below the Ministry's own end-decade projection |
| D | Above the Plan | 3.60% or higher | The Ministry's baseline projection for fiscal 2029 — while its costing assumption for fiscal 2027 is already 3.8%. Two government numbers, one below and one above this line |
That last boundary is not arbitrary and it is not ours. Under the Ministry's baseline estimate, the 10-year yield climbs to 3.6% in fiscal 2029, at which point debt-servicing costs rise to ¥41 trillion — against the ¥31 trillion ($195bn) currently set aside Reuters, Leika Kihara, Tokyo, 19 August 2026. Bucket D is the level at which the Ministry's own projection and its own budget arithmetic have stopped pointing the same way.
Starting level: 3.005% (1 September 2026). Horizon: 151 business days.
3.005% is Reuters' intraday quote. The arbiter for this question is the Ministry of Finance's own daily Interest Rate table, which we did not open for 1 September; the two series can differ by a basis point or two. The model is seeded on the Reuters print and we say so.
3. Prior and base rate
Reference class: the Japanese 10-year government bond yield itself — the same series, the same tenor, the same seven-month horizon. Source: FRED series IRLTLT01JPM156N, monthly, January 1989 to June 2026, 450 observations, pulled 1 September 2026. We use the identical series rather than an analogue class because an analogue class would be a choice and this is not.
Three cuts, all computed by the Desk from that series (base_rate.py, shipped with the data slice it reads):
| Reference class | n | Mean 7-month change | sd | Median |
|---|---|---|---|---|
| Full sample, 1989–2026 | 443 | −4.3bp | 0.4577pp | −1.3bp |
| Pre-ZIRP only (windows ending before Feb 1999) | 114 | −22.8bp | 0.7453pp | −34.1bp |
| Conditional: trailing 12-month rise ≥ +75bp | 26 | −23.9bp | 0.8350pp | −13.0bp |
All three say the same uncomfortable thing: after a large twelve-month rise, the Japanese 10-year has historically gone sideways or lower over the following seven months. The current twelve-month rise is roughly +135bp (1.645% in September 2025 to 3.005% today, monthly series spliced to Tuesday's print), which puts today squarely in the conditional class.
And all three are contaminated, which we say rather than hide. The 1989–1998 sub-sample is a secular disinflation: yields fell from 4.8% to under 2% over the decade, so the drift in that class is a one-way trend that has now reversed. The 1999–2024 sub-sample is not a market at all for these purposes — it is administered price, first zero-interest-rate policy and then yield-curve control, which truncates the distribution toward zero change and flatters the "nothing happens" bucket. This is the logged regime-change reason for departing from the raw base rate.
Our correction is to use the shape of each distribution with its drift removed, and to let the drift come from the model, where it can be argued about. De-trended, applied to a 3.005% starting level:
| De-trended class | A <2.75 | B 2.75–3.25 | C 3.25–3.60 | D ≥3.60 |
|---|---|---|---|---|
| Full sample | 21.7% | 59.1% | 12.0% | 7.2% |
| Pre-ZIRP | 37.7% | 30.7% | 15.8% | 15.8% |
| Conditional +75bp | 30.8% | 30.8% | 19.2% | 19.2% |
| Base-rate leg (equal blend) | 30.1% | 40.2% | 15.7% | 14.1% |
For comparison, the raw equal blend is A 41.3 · B 39.8 · C 6.5 · D 12.5. De-trending therefore moved 11.3 points out of A and 9.2 points into C. That is the largest single adjustment in this edition — larger than any parameter in the 22-specification envelope — and a reader who rejects the regime-change argument should use the raw row.
Three named analogues, with outcomes:
- Japan, the 2003 "VaR shock." The 10-year yield rose from roughly 0.4% to 1.6% in three months as banks' value-at-risk models forced simultaneous selling. It did not persist; the level round-tripped within a year. Why it may mislead: that was a pure microstructure event with no fiscal trigger and no policy normalisation behind it.
- The United Kingdom, September–October 2022. A fiscal announcement without a costing met a leveraged pension complex, gilt yields gapped, and the Bank of England intervened. Relevance: this is the template for bucket D. Why it may mislead: the UK's liability-driven investment leverage has no clean Japanese equivalent, and the trigger there was an unfunded tax cut announced with no forecast, not a budget request cycle.
- Japan, 1996–1998, the last time the 10-year sat at 3%. It fell from there for twenty-five years. Why it may mislead: the direction of causation was deflation, and the fiscal stock was less than half today's.
4. Evidence-update table
No probability below appears without the evidence that moved it.
| # | Evidence | Date | Direction | Strength | Effect on the distribution |
|---|---|---|---|---|---|
| 1 | Record ¥143trn FY2027 budget requests; over ¥10trn into an uncapped growth-and-security category | 31 Aug 2026 | ↑ yields | High | The single largest upward mover. Shifts weight from B into C and D; raises the modelled premium drift |
| 2 | The 1 September 10-year auction showed robust demand; the new bond "clears banks' deposit funding and lifers' liability costs with room to spare" — Shoki Omori, Deutsche Bank | 1 Sep 2026 | ↓ yields | Medium | The largest downward mover in the model. Introduces the state-dependent demand pull. One auction, and no bid-to-cover or tail was published — treat the magnitude of the cap as the least-evidenced parameter in this edition (see §5, and the sensitivity in §11) |
| 3 | July inflation 1.9% headline and 1.8% core, both below the 2% target — core has been below target in every month since February, held down by fuel subsidies | 21 Aug 2026 | ↓ yields | High | Removes the inflation-expectations channel entirely — headline and core are both below target. This is a term-premium move, not a price move |
| 4 | Government's FY2026 budget assumed a 3% long-term rate; ¥31trn set aside for debt service | 19 Aug / 1 Sep 2026 | Neutral, anchoring | High | Makes 3% a focal point rather than a threshold. Concentrates mass in B |
| 5 | Ministry baseline projection: 3.6% in FY2029 → ¥41trn debt service | 19 Aug 2026 | Defines D | High | Sets the D boundary. Not a forecast of ours |
| 6 | Ministry costing assumption for FY2027 raised to 3.8% from 3.0%, a 29-year high; record ¥36.64trn requested for debt service, ~¥5.4trn more than FY2026 | 21 / 25 Aug 2026 | Context, two-sided | High | Reframes D: the fiscal authority has already provisioned above our tail boundary. See §6 |
| 7 | Five scheduled BoJ Monetary Policy Meetings in the window; September hike described as near certain | BoJ schedules, 31 Jul 2025 / 31 Jul 2026 | ↑ yields | Low, in isolation | Almost nothing when re-weighted alone. See §5 — the model says a single meeting is not where the answer is |
| 8 | Yen near a four-decade low; the 31 July coordinated US–Japan intervention did not durably reverse it | 31 Jul – 3 Aug 2026 | ↑ yields | Medium | Sustains imported-inflation pressure and the case for faster normalisation |
| 9 | Analysts now see "a realistic path toward rates reaching 2%," above an earlier peak near 1.5% | 19 Aug 2026 | ↑ yields | Medium | Raises the terminal-rate centre used in the model to 1.85% |
| 10 | The Ministry can make ad hoc cuts to bond issuance — Ataru Okumura, SMBC Nikko | 19 Aug 2026 | ↓ yields | Medium | The two-sided event jump at the September investor meeting |
| 11 | The BoJ retains emergency bond-buying for "sharp, disorderly yield spikes" but sees little need now | 19 Aug 2026 | ↓ tail | Low | Modelled as a regime. It barely binds — see §5 |
| 12 | Global long ends rising together: US 30-year 5.22%, US 10-year 4.73% | FRED, 28 Aug 2026 | ↑ yields | Medium | A common global-duration factor, not a Japan story |
| 13 | Debt exceeding 200% of GDP; real GDP growth forecast +0.9% FY2026, +1.1% FY2027 | 1 Sep / Jul 2026 | ↑ yields | High | r > g at a 3% yield. Structural, not cyclical |
5. The Monte Carlo
A real simulation. The code ships as mc.py alongside this report; outputs are in mc_out.json. 50,000 paths, seed 20260901, numpy 2.2.6, 151 business days.
Structure. The yield follows a mean-reverting process around a moving anchor:
y(t) = y(t−1) + κ(y) · (θ(t) − y(t−1)) + σ·dW + global + jumps
where θ(t) is built from (i) the expected terminal BoJ policy rate, revised at each of the five scheduled Monetary Policy Meetings in the window — 18 September and 30 October and 18 December 2026, and 22 January and 18 March 2027, taken from the Bank's own published schedules — and (ii) a fiscal risk premium with positive drift and two-sided jumps on three dated fiscal events. κ(y) is state-dependent: weak below the domestic-demand hurdle, strengthening linearly above it. That mechanism is not an assumption pulled from the air — it is the Omori observation from Tuesday's auction, written as code.
Calibration, measured and not asserted. The diffusion term σ is pinned to the monthly standard deviation of the FRED series over the trailing twelve months (0.1088pp, giving 2.35bp/day). The total dispersion is then calibrated to the empirical seven-month standard deviation of the same series, 0.4577pp full sample. The achieved simulated dispersion is 0.4432pp — 3% below the target, and we report the residual rather than tune it away.
Central results:
| Bucket | Model | |
|---|---|---|
| A | below 2.75% | 17.70% |
| B | 2.75% – 3.25% | 53.12% |
| C | 3.25% – 3.60% | 16.47% |
| D | 3.60% or higher | 12.71% |
Median 3.036%, mean 3.114%, sd 0.443. Percentiles: P10 2.645 · P25 2.826 · P50 3.036 · P75 3.313 · P90 3.703 · P95 3.994. Path statistics: P(touching 3.60% at any point) 15.33%, P(touching 3.25%) 46.21%, P(touching 2.75%) 37.17%, P(finishing above today's level) 53.78%. Implied policy rate at fiscal year-end: mean 1.68% (1.00% 3.4% · 1.25% 14.0% · 1.50% 25.9% · 1.75% 28.8% · 2.00% 20.3% · 2.25% 7.6%).
Three findings from the model that we did not expect, and that change how we read the tape.
(i) Re-weighting the September meeting on its own is worth almost nothing. Moving the September hike probability from 60% to 99% while holding the other four meetings' probabilities fixed moves bucket D by 0.5pp and the median by 0.2bp. The qualifier matters: in the market a September surprise would re-price the whole path, and our specification does not let it. What the model establishes is narrower and still useful — re-weighting a single meeting, path held constant, is worth almost nothing next to where domestic liability costs clear. The mechanism is arithmetic: the 10-year prices the terminal rate, a single 25bp move revises the terminal expectation by around 5bp, and the 10-year loads about 0.55 on that revision — roughly 3bp.
(ii) The level of the terminal rate is unidentified; only revisions to it matter. Centring the terminal rate at 1.60% and at 2.10% produces identical distributions to three decimals. This is true by construction — the 10-year already prices today's terminal view, so only news about it moves the yield — and we publish it rather than let a reviewer find two identical rows and wonder.
(iii) The dispersion assumption is worth more than any view about Japan. At an intuitive, un-calibrated premium volatility the model returns sd 0.309 and D = 4.6%. Calibrated to the historical seven-month dispersion it returns sd 0.443 and D = 12.7%. Choosing to match history rather than intuition nearly triples the tail. Anyone publishing a tail probability on this question without saying what dispersion they assumed has published nothing.
Specification envelope, 22 alternative specifications, same code, same seed: A [13.2%, 21.5%] · B [41.2%, 60.4%] · C [13.9%, 21.9%] · D [3.4%, 21.2%]. Sampling error is trivial by comparison and is explicitly demoted: the standard error on D is 0.149pp, and four different seeds return 12.71 / 12.42 / 12.44 / 12.56. The structural envelope on D is 17.8pp wide; the sampling envelope is 0.3pp. The ratio is roughly 60 to 1. The uncertainty in this number is about the model, not about the random draws.
The most powerful single parameter is the demand hurdle. Moving it 25bp lower takes D from 12.7% to 21.2%; 25bp higher takes it to 6.1%. Where Japanese lifers' liability costs actually clear is the number that decides this question, and we have exactly one dated observation of it — Tuesday's auction.
A regime that barely binds. The BoJ emergency-operations branch fires on 0.47% of paths, and switching it off entirely changes the bucket probabilities by at most 0.22 percentage points — on bucket A, 17.70% to 17.48%; bucket D moves 0.04pp. At a historically calibrated volatility, a disorderly gap is not the modal risk. The grind is the risk. This is also a limitation: the branch is in the code but is effectively untested at this calibration.
Documented limitations. (1) Monthly data understate intramonth volatility, so the dispersion is a floor. (2) The per-meeting hike probabilities are the Desk's, informed by dated market commentary; no JPY overnight-index-swap curve was read for this edition — treat them as an assumption, not a market price. (3) The state-dependent pull is calibrated to one observation. (4) The BoJ emergency regime is a modelled possibility, not announced policy. (5) The FY2027 draft-budget and Diet-passage dates follow Japan's ordinary calendar and are modelled, not verified. (6) No auction-tail microstructure, credit or liquidity channel is modelled. MiroFish was not run and is not implied.
6. The scenarios
Aggregation rule, applied and shown. Base rate 0.30 · expert priors 0.30 · simulation 0.40. The base rate is down-weighted from its 0.40 default because the reference class is contaminated by thirty-five years of secular disinflation and twenty-five years of administered pricing, as set out in §3. The simulation is up-weighted because it is the only input that carries the dated event calendar and the demand mechanism the 1 September auction actually evidenced. The expert-prior leg is the Desk's translation of named qualitative views into buckets — that translation is a real weakness and we name it.
0.30 × [30.1, 40.2, 15.7, 14.1] + 0.30 × [10, 50, 30, 10] + 0.40 × [17.7, 53.1, 16.5, 12.7] = [19.1, 48.3, 20.3, 12.3] → published [20, 50, 20, 10]
A — The Retreat · 20%
The 10-year finishes fiscal 2026 below 2.75%, giving back the whole of the summer's move.
This is the scenario the base rate likes and the narrative hates. It needs two of three things: the Ministry of Finance to trim long-end issuance at or after its September investor meeting, which Ataru Okumura of SMBC Nikko has said "could help curb yield rises"; the oil impulse from the Middle East conflict to fade, taking imported inflation and the case for faster normalisation with it; and Japanese domestic buyers — banks, life insurers, and the pension complex — to keep clearing auctions as comfortably as they did on Tuesday. Nothing here requires a Bank of Japan reversal. It requires the supply shock to be smaller than the demand response, which at a 3% coupon is a live possibility for the first time in a generation.
Trigger: an ad hoc issuance cut at the long end, or a September–October Brent retreat below $80. Tripwire that resolves it: two consecutive 10-year auctions with bid-to-cover above the trailing average and no tail; the 30-year back below 3.90%.
B — The Plateau · 50% · BASE CASE
The 10-year finishes between 2.75% and 3.25% — that is, within 25bp of the number the government's own budget already assumes.
The base case is not "nothing happens." It is that two large forces cancel. On one side, the heaviest budget request in Japanese history, more than ¥10trn of it into a category with no ceiling, a food levy cut costing revenue, debt above 200% of GDP, and real growth of 0.9% against a 3% funding cost — the definition of an unfavourable r-minus-g. On the other, a yield that has finally risen far enough to recruit the largest pool of captive domestic savings in the world. The 1 September auction is the evidence: demand appeared, at this level, without the Bank of Japan. The plateau is what it looks like when a bond market finds a clearing price rather than a crisis.
Note what B does not require: it does not require the Bank of Japan to stop hiking. The model has the policy rate at 1.75% or above on 57% of paths and still puts the modal 10-year inside this band, because the curve has already done the work.
Trigger: the FY2027 draft budget lands in late December within the range the request cycle implied, and the Bank hikes into a market that has already priced it. Tripwire that resolves it: the 10-year holding a 2.80–3.20 range through the December budget week.
C — The Overshoot · 20%
The 10-year finishes between 3.25% and 3.60%: above the government's own budget assumption, below the Ministry's end-decade projection.
This is the scenario in which the bond market's warning becomes a price. Ryutaro Kimura of BNP Asset Management described Tuesday's tape precisely: "Through the rise in yields so far, the bond market has to some extent been sounding a warning against fiscal expansion… From the bond market's perspective, I think there is now something of a sense of resignation — tinged with helplessness — about rising interest rates." C is resignation compounding. The December draft budget confirms the request cycle rather than trimming it; the ¥31trn set aside for debt service in the current year starts to look like a planning number rather than a ceiling; and each 25bp of realised yield rise makes the next budget harder, which makes the next 25bp easier.
Trigger: an FY2027 draft budget at or above ¥120trn with new net issuance rising year on year. Tripwire that resolves it: the 10-year closing above 3.30% for five consecutive sessions with the 30-year above 4.40%.
D — Above the Plan · 10% · TAIL
The 10-year finishes at or above 3.60% — above the Ministry's own baseline projection for the 10-year in fiscal 2029, at which point it puts debt service at ¥41trn against ¥31trn provisioned.
Read that alongside the Ministry's separate budget-costing rate, and D stops being a doomsday scenario and becomes something more interesting. The costing rate for fiscal 2027 is already 3.8% — above our tail boundary. But that 3.8% is not a projection; it is prevailing yields plus roughly 1.1 percentage points of prudential buffer, set in late August when the market was near 2.7%. So the Ministry has provisioned for a level it does not expect, and its two numbers — a 3.6% projection for 2029 and a 3.8% costing rate for 2027 — have stopped pointing the same way. Bucket D is the region where that inconsistency becomes a market price rather than a budgeting convention.
There is a second-order sting in the convention itself. If the Ministry re-padded today, off 3.005% rather than 2.7%, the fiscal 2027 costing rate would be closer to 4.1%. The buffer is mechanical, so a market that grinds higher does not merely raise the interest bill — it raises the provision against the interest bill, and the provision is what crowds out the growth strategy.
The mechanism that gets us here runs through the demand hurdle: if domestic buyers' liability costs sit higher than Tuesday's auction implied — if 3% clears banks but not the long end of the insurance complex — the state-dependent pull that caps B and C weakens, and the model's D probability doubles. The UK in autumn 2022 is the template for how fast this leg can travel once it starts, with the caveat that Japan has no comparable leveraged pension channel and a far deeper captive domestic bid.
Trigger: a failed or heavily tailed 20-year or 30-year auction, or a supplementary budget on top of the FY2027 draft. Tripwire that resolves it: the 30-year above 4.60% with the 10-year above 3.50% and the yen weaker on the same session — yields up and currency down is the fiscal-risk signature, and it is the one indicator that separates D from ordinary normalisation.
7. Market pricing versus the Desk view
| Market or house view, dated | Desk | Gap | |
|---|---|---|---|
| September BoJ hike | Priced as "near certainty" (Reuters, 1 Sep) | Modelled at 90% | Agreement |
| Terminal policy rate | Analysts now see "a realistic path toward rates reaching 2%," up from a 1.5% peak (Reuters, 19 Aug) | Centre 1.85%, dispersion 0.46 | Aligned |
| 10-year, end-2026 | Oxford Economics, Research Briefing, 14 August 2026 (Yasuko Koido): "We now think the long-term JGB yield will rise to around 3% by the end of 2026, instead of staying at 2.8%" | Model median at fiscal year-end 3.04% | Aligned — and note the forecast was revised up to a level the market printed within three weeks |
| Where the fiscal effect gets priced | Oxford Economics, 14 Aug 2026, names the September tax policy outline and the December fiscal 2027 budget process | The Desk's model puts the weight on the December budget | Independent corroboration of our most contestable claim |
| 10-year, further out | Ministry of Finance baseline projection: 3.6% in FY2029. Ministry costing assumption for FY2027: 3.8% | 12.7% probability of 3.6% by March 2027 | The Desk sits below the government's own costing rate and above its projection timetable |
| Tail risk | Capital Economics, Capital Daily, 6 January 2026 (John Higgins): "We doubt the 10-year JGB yield will soar a lot more in 2026" — stated against the house's end-2026 forecast of 2.25%, a level the market has since exceeded by roughly 75 basis points | 15.3% probability of touching 3.60% at some point in the window | We carry this as the dovish prior on record and note it has not been restated since the 3% print |
The highest-conviction disagreement: the market's attention allocation. Every desk in Tokyo is positioned around 17–18 September. Our model says re-weighting that single meeting, with the rest of the path held constant, is worth half a percentage point of the fiscal-year-end distribution, while a 25bp error in where domestic liability costs clear is worth eight to nine points. Oxford Economics, independently, names September's tax policy outline and December's budget as the pricing events. The important meeting is the Cabinet's, in late December, at least as much as the Bank's, in mid-September.
What would prove us wrong: a September or October 10-year auction that tails badly. Our base case rests on Tuesday's auction being representative of domestic demand at 3%, and one auction is one observation — with no published bid-to-cover or tail behind it.
8. Universal-owner portfolio map
Rows are asset classes; entries are the direction and magnitude band of the reprice under each scenario, over the seven-month question horizon. Strategic, not advisory.
| Asset class | A — Retreat (20%) | B — Plateau (50%) | C — Overshoot (20%) | D — Above the Plan (10%) |
|---|---|---|---|---|
| JGBs, 10y | ↑ price, +2 to +4% | flat, ±2% | ↓ 2 to 4% | ↓ 5 to 9% |
| JGBs, 30y | ↑ 5 to 9% | ↓ 0 to 4% | ↓ 6 to 12% | ↓ 12 to 20% |
| Global sovereign duration (US/EU) | ↑ modest | flat, Japan-neutral | ↓ 1 to 3%, via the repatriation bid leaving | ↓ 3 to 6% |
| USD/JPY | yen weaker on carry | range | yen stronger on rate differential | two-sided — the regime discriminator |
| Japanese equities, banks | ↓ | ↑ net interest margin | ↑ margin, ↓ bond book | ↓ mark-to-market dominates |
| Japanese equities, broad | ↑ | flat | ↓ 5 to 10% | ↓ 12%+ |
| Japanese life insurers | ↓ reinvestment yield | ↑ — liabilities discounted higher, assets clear | ↑ solvency, ↓ book | ↓ impairments dominate |
| Global credit | tighter | flat | wider, via duration | materially wider |
| Global infrastructure & real assets | ↑ | flat | ↓ on discount rate | ↓ sharply on discount rate |
| Private equity, private credit | neutral | neutral to ↓ marks | ↓ marks, slower exits | ↓ marks, financing stress |
| Gold and reserves | flat | flat | ↑ | ↑ |
| EM local debt | ↑ | flat | ↓ on carry unwind | ↓ sharply |
The line that matters to a non-Japanese allocator is the third one. Japan held $1,185.5bn of US Treasuries at end-December 2025, the largest foreign holding in the world US Treasury, TIC, Major Foreign Holders of Treasury Securities. GPIF alone held ¥73.4trn (24.48% of a ¥294trn portfolio) in foreign bonds as at 31 March 2026 Reuters Factbox, 10 July 2026. Japanese investors sold a reported ¥3.42trn ($21.8bn) of overseas bonds in February 2026, the most since 2024 (that flow figure: medium confidence — taken from dated secondary reporting; the Ministry's weekly portfolio-flow tables were not opened for this edition).
If a Japanese life insurer can meet its liability cost in yen, without currency hedging, at home — which is what Deutsche Bank's Omori said Tuesday's auction demonstrated — then the marginal bid for global duration that Japan has supplied for three decades does not need to exist. That is a repricing of the world's long end that has nothing to do with the world's long end.
9. Second- and third-order effects
- The subsidy loop. Fuel subsidies are holding measured inflation below the 2% target — headline 1.9%, core 1.8% in July — while adding to the deficit that is pushing yields up. The policy that suppresses the printed inflation rate is the policy that raises the bond supply. Withdrawing it raises CPI and reduces issuance simultaneously; keeping it does the reverse. There is no version of this that is neutral for the 10-year.
- Debt service crowds out the growth strategy, and it is doing it now. METI asked for ¥6.3trn for AI, semiconductors and robotics. On the Ministry's own path, debt service rises about ¥10trn between now and fiscal 2029 — and ¥5.4trn of that is already inside the fiscal 2027 request submitted on 31 August. The industrial policy and the interest bill are competing for the same yen next year, not at the end of the decade, and the interest bill does not lose votes.
- The repatriation channel runs in reverse through everyone else's curve. See §8. A Japanese bid that stops arriving is a term-premium rise in Washington, Berlin and Paris that no Western fiscal event explains.
- The carry trade's funding leg reprices. A 2% Japanese policy rate with a 3%+ 10-year is a different funding environment for every leveraged cross-currency strategy in the market. Unwinds are correlated and fast.
- The Bank of Japan's balance sheet becomes fiscal. A central bank tapering its JGB holdings into a rising-supply market is selling into the same wind the Ministry is issuing into. Emergency buying resolves the yield and re-politicises the institution.
- The intervention precedent has a shelf life. The 31 July coordinated US–Japan yen purchase, confirmed by both treasuries on 3 August — the first joint yen-buying since 1998 — did not durably reverse the trend: the yen rallied from a four-decade low of 163.73 to 155.20 on the announcement, then gave most of it back, trading 159.97 by 28 August. A second intervention that also fails is worse than no second intervention, and both governments know it.
- Solvency regimes reward the plateau. For Japanese insurers, higher risk-free rates discount liabilities down faster than they mark assets down, up to a point. B is genuinely good for them. D is not.
- The prudential buffer is itself procyclical. The Ministry's costing rate is prevailing yields plus about 1.1 percentage points. Every rise in the market therefore raises the provision as well as the bill, and the provision is the number that crowds out discretionary spending in the draft budget.
- Global allocators lose a diversifier. A JGB that yields 3% is an asset again — but it is an asset that is correlated with the fiscal risk it is priced off, which is not what a 25-year allocation model assumes.
10. Watch dashboard
| # | Indicator | Reading, dated | Threshold that moves the model |
|---|---|---|---|
| 1 | 10-year JGB (MoF daily) | 3.005%, 1 Sep 2026 | Five closes >3.30% → C live; >3.50% with 30y >4.60% → D live |
| 2 | 30-year JGB | 4.18% record close, 1 Sep 2026 | >4.60% → D; <3.90% → A |
| 3 | 20-year JGB | 3.885%, 1 Sep 2026 | Sustained >4.10% confirms the long-end supply story |
| 4 | 10-year auction bid-to-cover and tail | Robust, 1 Sep 2026 | Any material tail invalidates the base case |
| 5 | September tax policy outline | Due September 2026 | Named by Oxford Economics as a pricing event; a funded outline → A/B, an unfunded one → C |
| 6 | BoJ policy rate | 1.00%, held 31 Jul 2026 | 17–18 Sep decision; watch the dissent count, not the outcome |
| 7 | MoF investor meeting on issuance | September 2026 | Any long-end issuance cut → A |
| 8 | FY2027 draft budget, Cabinet | Late December 2026 | ≥¥120trn with rising net issuance → C |
| 9 | Japan core CPI (ex fresh food) | 1.8% y/y, July 2026 | Sustained >2.2% adds an inflation channel we currently do not model |
| 10 | Japan PPI | 7.2% y/y, reported 13 Aug 2026 | Pass-through into core would break the "below target" argument |
| 11 | USD/JPY | 159.97, 28 Aug 2026 (FRED DEXJPUS) |
>170 with yields rising = fiscal repricing, not normalisation |
| 12 | US 30-year | 5.22%, 28 Aug 2026 | The global-duration factor; >5.50% drags Japan with it |
| 13 | Japanese net purchases of foreign bonds (MoF weekly) | Net selling reported through 2026 | Three consecutive net-selling months confirms the repatriation channel |
| 14 | Japan holdings of US Treasuries (TIC) | $1,185.5bn, Dec 2025 | A sustained decline is the second-order effect made visible |
| 15 | Brent | $88.24, 25 Aug 2026 (FRED) | <$80 by October → A; >$100 sustained → C |
| 16 | BoJ emergency operations | None conducted | Any emergency purchase is a regime change; re-run this question |
11. Red team — how this could be wrong
1. One auction is one observation, and the whole base case rests on it. The state-dependent demand mechanism — the thing that caps C and D and gives B its 50% — is calibrated to a single dated data point: Tuesday's 10-year auction and one strategist's read of it. No bid-to-cover and no tail were published. If Japanese insurers were buying the belly because it is the belly, and not because 3% clears liabilities, the pull is weaker than modelled and the correct distribution is closer to the "hurdle 25bp lower" row of the envelope: A 20.1 / B 41.2 / C 17.4 / D 21.2. That single row doubles the tail. What would falsify our version: a tailed 10-year or 20-year auction in September or October.
2. We may be looking at the wrong maturity. The record on Tuesday was set at the 30-year (4.18%), not the 10-year. Japan's fiscal stress, if it expresses itself, will express itself first in the sector where the domestic buyer base is thinnest and the duration risk is largest. A question posed on the 10-year could resolve in bucket B while the 30-year goes to 5% and every long-dated liability on earth reprices. We think the 10-year is the right question because it is the government's own budget variable — but that is a choice, and it is arguable.
3. The base rate may be telling the truth and we may be over-riding it. All three reference classes point down. We de-trended them and let the model supply the drift, which moved 11.3 points out of A and 9.2 points into C — the largest single adjustment in this edition. It is a defensible correction, and it is also exactly the move by which an inside view smuggles itself past the outside view. A reader who thinks 1989–2026 Japan is a better guide than our event calendar should read the un-adjusted full-sample row — A 24.6 / B 58.0 / C 11.5 / D 5.9 — and weight the tail at half of ours.
Also disclosed: no JPY overnight-index-swap curve was read for this edition, so every policy probability here is an assumption rather than a price; the last-3%-print date is given as September 1996 by Reuters and October 1996 by Kyodo; and Japan's July inflation was 1.9% headline and 1.8% core, both below the Bank's 2% target — there is no tension between them, and an earlier draft of this edition carried a 3.1% figure that belongs to July 2025 and has been removed.
Methodology box
Probabilities are the UAO Probability Desk's, weighted across base-rate, expert-prior and simulation inputs by a written rule (base rate 0.30 · expert priors 0.30 · simulation 0.40, with the departures from default weights logged in §6). Base rates are computed by the Desk from FRED series IRLTLT01JPM156N, 450 monthly observations, January 1989 to June 2026, in base_rate.py, shipped with the data slice it reads. The Monte Carlo is 50,000 paths, seed 20260901, numpy 2.2.6, shipped as mc.py with mc_out.json; a 22-specification envelope and a four-seed stability check are published with it. MiroFish was not run and is not implied. Weights are rounded to the nearest 5%; the unrounded aggregate is 19.1 / 48.3 / 20.3 / 12.3, so the rounding took 2.3 points off the tail — a conservative rounding, and disclosed. Methodology available on request. Every scenario is logged in the public calibration record and graded when it resolves.
Resolution: Ministry of Finance daily JGB Interest Rate table, 10-year, as first published, for the last JGB business day on or before 31 March 2027. Interim checkpoints: 18 September 2026, 30 October 2026, 24 December 2026 (FY2027 draft budget), 22 January 2027.
This edition was reviewed before publication by an independent scenario-review gate, which returned FLAG on 28 items. Every required edit was applied. The review is published in full alongside this report.
This report is for informational and research purposes only and does not constitute investment, legal, tax, or financial advice.
Editorial scenario analysis only. Not investment, actuarial, or geopolitical advice.
Source ledger
| # | Source | Date | Data point used | Conf. | Moves the model |
|---|---|---|---|---|---|
| 1 | Reuters (Swift & Buckland), via WTVB | 1 Sep 2026 | 10y 3.000%/3.005%; 5y 2.265% record; 2y 1.81%; 20y 3.885%; 30y 4.18% record close; 3% budget assumption; debt >200% GDP; Kimura and Omori quotes; robust auction demand | H | Yes — trigger and the demand mechanism |
| 2 | Kyodo, via Japan Today | 1 Sep 2026 | 3.000%, "highest since October 1996"; ¥143trn requests ($890bn); debt twice GDP | H | Yes — trigger |
| 3 | Reuters (Kihara), via Yahoo Finance | 19 Aug 2026 | ¥31trn debt service provisioned; MoF baseline 3.6% in FY2029 → ¥41trn; GDP +0.9%/+1.1%; subsidies keeping core below target; Iwashita, Muguruma, Okumura quotes; 2.945% high 18 Aug; ¥159.32 | H | Yes — defines bucket D |
| 4 | Japan Today / Kyodo | 31 Aug 2026 | FY2027 requests ¥143trn; MHLW ¥36.58trn; Defense ¥8.89trn; METI ~¥6.3trn; >¥10trn into the uncapped investment category | H | Yes — premium drift |
| 5 | Jiji, via Nippon.com | 21 Aug 2026 | FY2027 assumed long-term bond interest rate to be raised to 3.8% from 3.0% | H | Yes — reframes bucket D |
| 6 | Jiji, via Nippon.com | 25 Aug 2026 | Record ¥36,638.6bn sought for debt servicing in the FY2027 request | H | Yes |
| 7 | The Japan Times | 22 Aug 2026 | The 3.8% assumed rate; the convention of adding ~1.1pp to prevailing yields as a spike buffer | H | Yes — the §6 arithmetic |
| 8 | Nikkei Asia | Aug 2026 | FY2027 requests ≈$895bn, record | M | Corroboration |
| 9 | BoJ, Scheduled Dates of MPMs in 2026 (PDF) | 31 Jul 2025 | 17–18 Sep, 29–30 Oct, 17–18 Dec 2026 | H | Yes — event calendar |
| 10 | BoJ, Scheduled Dates of MPMs in 2027 (PDF) | 31 Jul 2026 | 21–22 Jan, 17–18 Mar 2027 | H | Yes — event calendar |
| 11 | US Treasury, TIC — Major Foreign Holders | Dec 2025 vintage | Japan $1,185.5bn, largest foreign holder; grand total $9,269.5bn | H | Portfolio map |
| 12 | FRED IRLTLT01JPM156N |
1989-01→2026-06, pulled 1 Sep 2026 | 450 obs; last 2.67 (Jun 2026); Sep 2025 1.645 | H | Yes — the entire base rate |
| 13 | FRED DGS10 |
28 Aug 2026 | US 10y 4.73 | H | Global factor |
| 14 | FRED DGS30 |
28 Aug 2026 | US 30y 5.22 | H | Global factor |
| 15 | FRED DGS20 |
28 Aug 2026 | US 20y 5.21 | H | Context |
| 16 | FRED DGS2 |
28 Aug 2026 | US 2y 4.34 | H | Context |
| 17 | FRED DEXJPUS |
28 Aug 2026 | USD/JPY 159.97 | H | Watch dashboard |
| 18 | FRED EXJPUS |
Jul 2026 | USD/JPY monthly 162.33 | H | Context |
| 19 | FRED DTWEXBGS |
28 Aug 2026 | Broad USD 118.75 | H | Context |
| 20 | FRED DCOILBRENTEU |
25 Aug 2026 | Brent $88.24 | H | Watch dashboard |
| 21 | FRED T10YIE |
31 Aug 2026 | US 10y breakeven 2.31 | H | Context |
| 22 | FRED T5YIFR |
31 Aug 2026 | 5y5y forward breakeven 2.31 | H | Context |
| 23 | FRED DFII10 |
28 Aug 2026 | US 10y real 2.42 | H | Context |
| 24 | FRED BAMLH0A0HYM2 |
31 Aug 2026 | US HY OAS 2.63 | H | Portfolio map |
| 25 | FRED VIXCLS |
31 Aug 2026 | VIX 14.92 | H | Context |
| 26 | Bloomberg | 1 Sep 2026 | 10y hits 3%, first since 1996 | M | Corroboration |
| 27 | Euronews | 1 Sep 2026 | 3% print; rate hikes dominate the G20 | M | Corroboration |
| 28 | Euronews | 17 Aug 2026 | 10y at a 30-year high; growth data disappoints | M | Path context |
| 29 | CNBC | 31 Jul 2026 | BoJ holds at 1%; warns of core inflation exceeding 2% | M | Policy starting point |
| 30 | Bloomberg | 27 Aug 2026 | Deputy Governor Himino keeps the door open to a September increase | M | Hike probability |
| 31 | MUFG Research, Japan Economic & Financial Weekly | 17 Aug 2026 | BoJ to 1.25% in September | M | Expert prior |
| 32 | CNBC | 3 Aug 2026 | Coordinated US–Japan yen purchase conducted 31 July, confirmed 3 August; first joint yen-buying since 1998 | M | Second-order effects |
| 33 | The Japan Times | 3 Aug 2026 | Joint intervention confirmed | M | Corroboration |
| 34 | Al Jazeera | 3 Aug 2026 | Rare joint intervention | M | Corroboration |
| 35 | Goldman Sachs Exchanges | Aug 2026 | House discussion of the intervention's rate and dollar consequences | M | Expert prior |
| 36 | CNBC | 13 Aug 2026 | Japan wholesale inflation 7.2% y/y, undershooting expectations | M | Watch dashboard |
| 37 | FXStreet | 21 Aug 2026 | July 2026: core CPI 1.8% y/y, core-core 1.9%, headline 1.9% — all below the 2% target | H | Evidence row 3 |
| 38 | Oxford Economics, Research Briefing (Yasuko Koido) | 14 Aug 2026 | "We now think the long-term JGB yield will rise to around 3% by the end of 2026, instead of staying at 2.8%"; names the September tax policy outline and the December FY2027 budget process as the pricing events | M | Expert-prior leg; corroborates §7 |
| 39 | Oxford Economics | 2026 | The earlier end-2026 forecast of 2.8%, since superseded by #38 | M | Expert-prior leg |
| 40 | Capital Economics, Capital Daily (John Higgins) | 6 Jan 2026 | "We doubt the 10-year JGB yield will soar a lot more in 2026" — against an end-2026 forecast of 2.25%; not restated since the 3% print | M, and stale | Expert-prior leg — the dissent, carried with its date |
| 41 | The Japan Times | 5 Mar 2026 | Japanese investors sold ¥3.42trn ($21.8bn) of overseas bonds in February, most since 2024 | M — page not opened | Portfolio map |
| 42 | Reuters Factbox, via Investing.com | 10 Jul 2026 | GPIF ¥294trn total at 31 Mar 2026; foreign bonds ¥73.4trn (24.48%); domestic bonds ¥80.7trn (26.91%) | H | Portfolio map |
| 43 | GPIF, Policy Asset Mix (PDF) | Current policy portfolio | Policy asset mix framework | M | Portfolio map |
| 44 | Bloomberg | 27 Jan 2026 | Bond moves raise questions over the $1.8trn pension fund's next move | M | Second-order effects |
| 45 | CNBC | 14 Jul 2026 | Japan's bond market "back in play after decades in the wilderness" | M | Context |
| 46 | Reuters, via Investing.com | 1 Sep 2026 | Same wire, independent carriage | M | Corroboration |
Sources 12–25 were pulled live from FRED via content-engine/research/data_spine.py on 1 September 2026 and are reproducible with the series identifiers shown. The IRLTLT01JPM156N slice used for the base rate ships with this report as jgb10y_monthly.json.
Continue the briefing. Read the daily brief · watch the daily video briefing · listen to The Universal Owner · view the chart of the day.
Produced and edited by the UAO editorial desk. Not investment advice.