
|
|
THE PROBABILITY DESK · 19 AUGUST 2026
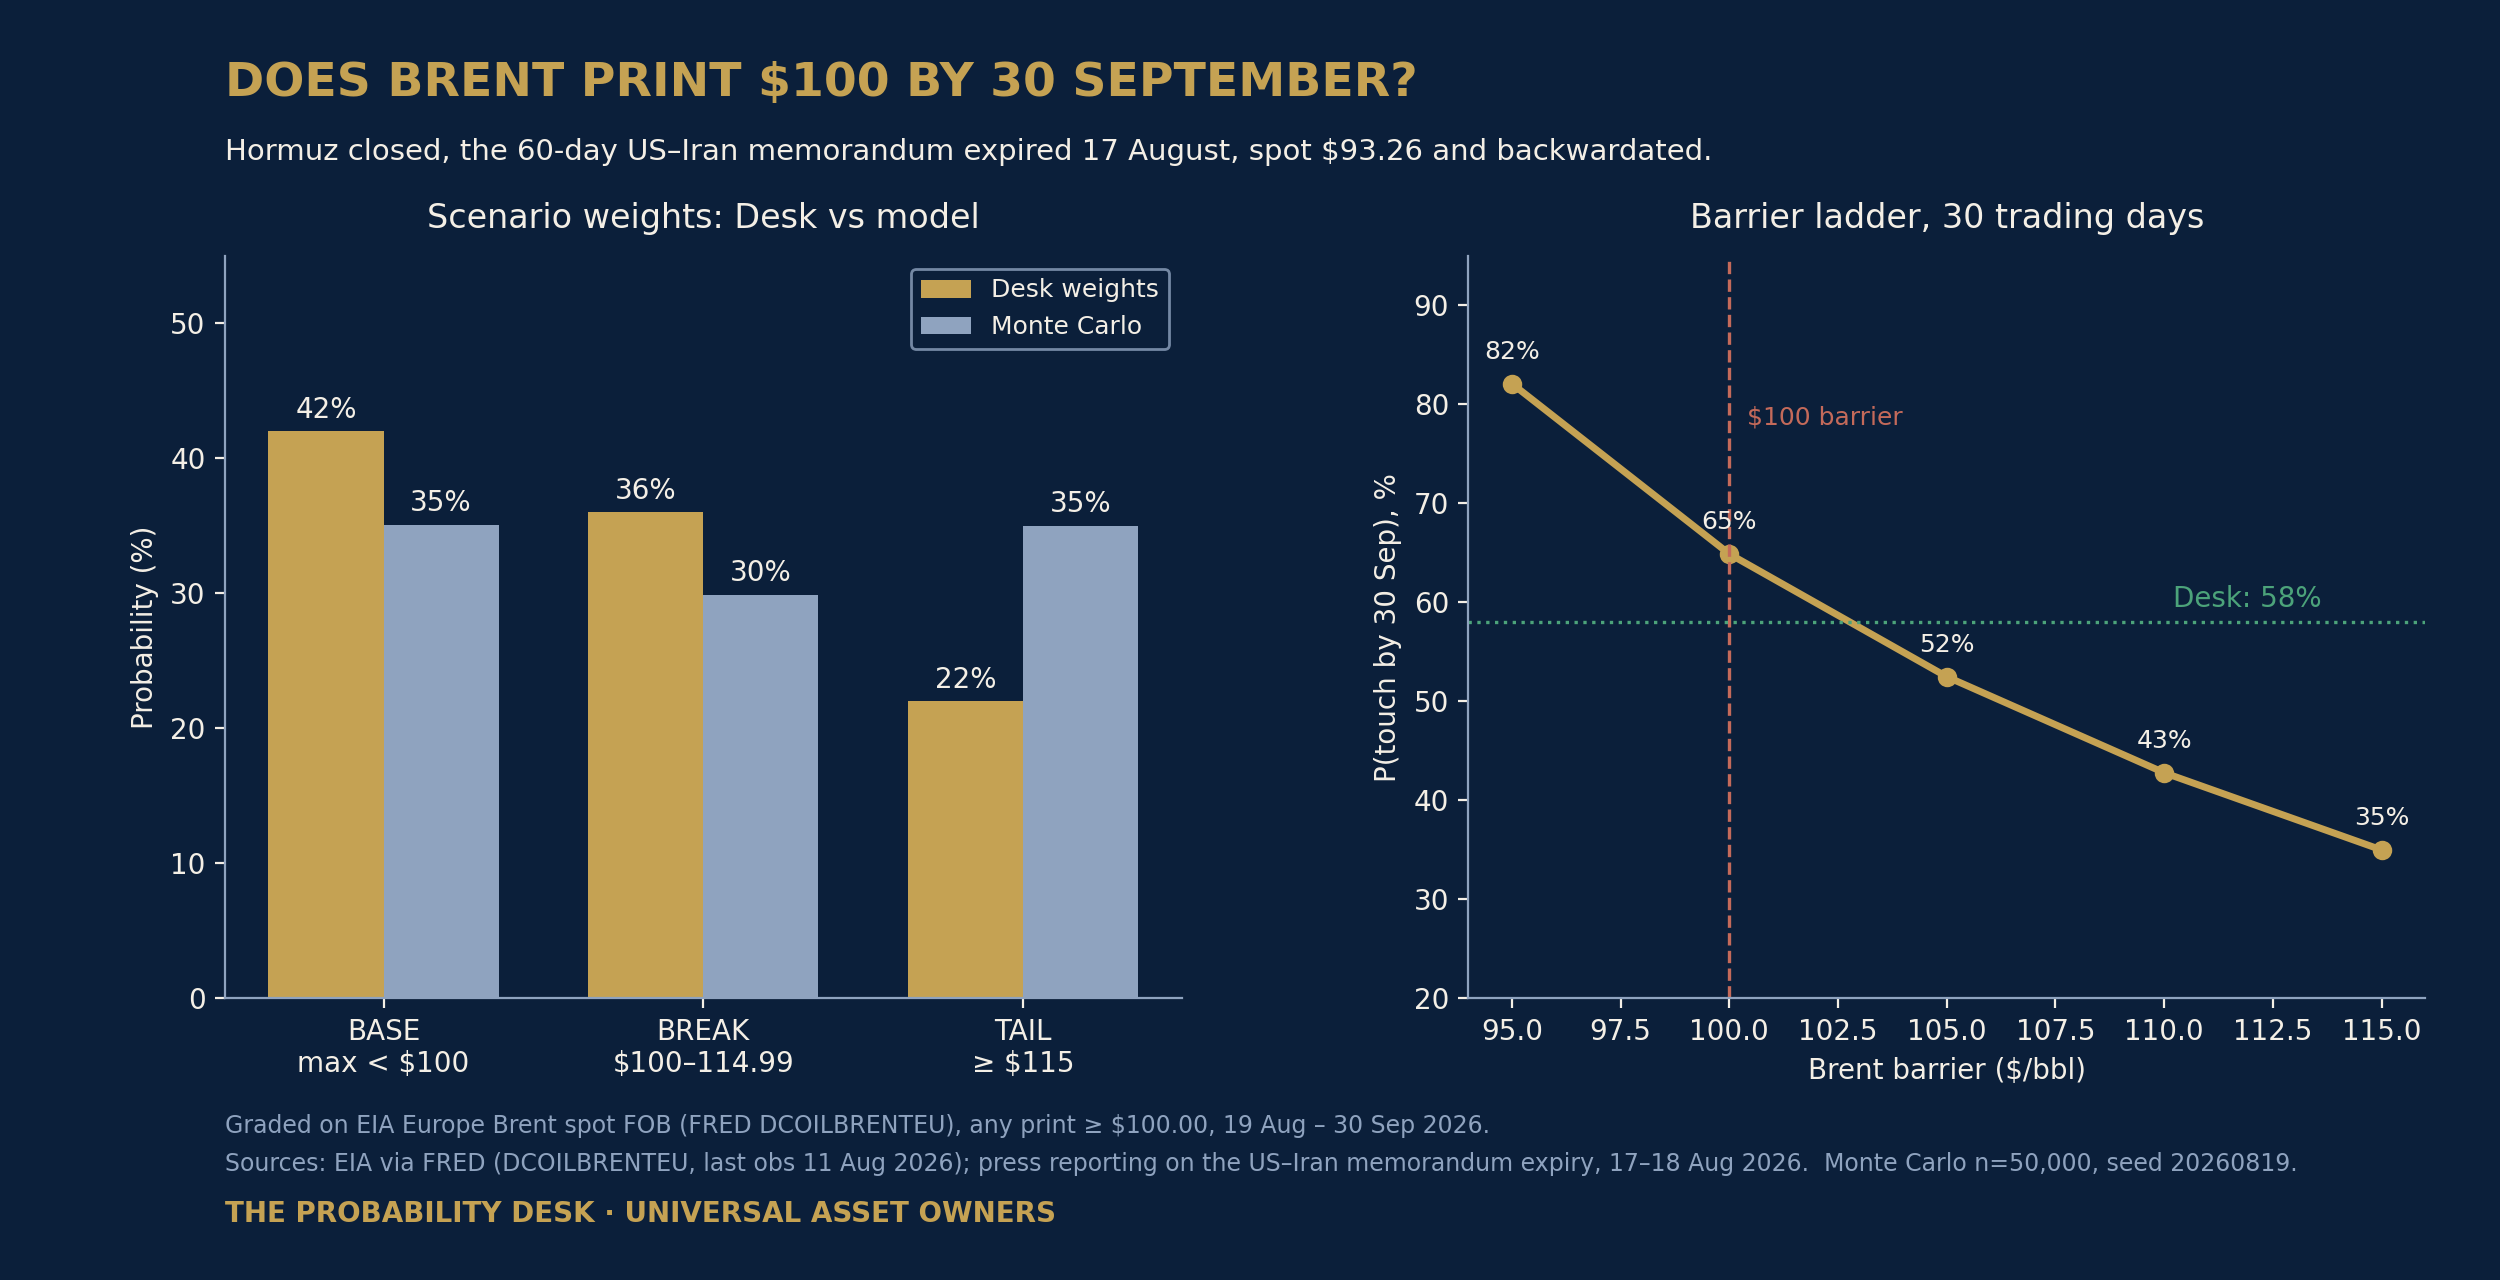
The memorandum is dead, the strait is still shut, and spot Brent sits seven dollars from a number the market has not printed since March. The Desk puts 58% on a $100 print by the end of September — below its own model, and well below what a naive volatility read would tell you.
The Trigger
The 60-day memorandum of understanding between Washington and Tehran expired on 17 August with no successor deal and no extension. The document, signed in mid-June after the spring war, committed both sides to a final agreement on Iran's nuclear program and sanctions relief "in maximum 60 days," with extension possible by mutual consent. Consent did not come: the President told reporters he was not looking to extend, demanded surrender terms, and threatened to bomb Oman — the mediator — if it "gets in the way." The Strait of Hormuz, closed to normal traffic since February, saw three transits on Sunday against roughly 130 a day before the war. Brent futures rose for a third straight session on 18 August to trade above $91; the last official spot print, 11 August, was $93.26, and the curve remains backwardated — the physical market still pays a premium for barrels now.
The Forecast Question
Does the Europe Brent spot price (FOB) print at or above $100.00 per barrel on any business day from 19 August through 30 September 2026?
Graded on the U.S. Energy Information Administration's daily Europe Brent Spot Price FOB series as published on FRED (series DCOILBRENTEU). Any single daily print ≥ $100.00 within the window resolves YES. Approximately 30 trading days. Resolution on the first business day after 30 September on which FRED has published through the window's final date; the first published print governs over any later revision.
Outcomes are graded on the window maximum and are mutually exclusive and exhaustive: BASE — the maximum stays below $100; BREAK — the maximum lands between $100.00 and $114.99; TAIL — the maximum reaches $115.00 or higher.
Prior / Base Rate
Since 1990, from any starting day, Brent has touched a level 7.2% above spot within 30 trading days 48.6% of the time (9,224 windows). Condition on turbulence and the odds rise: when trailing 30-day realised volatility is at or above 40% annualised — it is 78% today — the touch rate is 61.3% (2,017 windows); in the 25–40% band it is 52.1%. Within the closure period itself the spot series has ranged from $68.53 to $138.21. The uninformed prior, in other words, is close to a coin toss; the volatility-conditioned prior leans meaningfully toward a print.
The Evidence-Update Table
| Evidence | Direction | Weight |
|---|---|---|
| MOU expired 17 Aug; extension ruled out publicly; surrender rhetoric | Toward YES | Heavy |
| Hormuz transits ~3/day vs ~130 pre-war; no restoration mechanism on the table | Toward YES | Heavy |
| Threat against the mediator (Oman) degrades the only working diplomatic channel | Toward YES | Moderate |
| Three consecutive up sessions into the expiry; market only began pricing lapse on 17–18 Aug | Toward YES | Moderate |
| March peak ($118–120 futures) faded back to the $80s without a deal — rerouting, releases and demand response absorbed the first shock | Toward NO | Heavy |
| Backwardated curve: forwards sit below spot; the market's central path is down, not up | Toward NO | Moderate |
| Both sides wrote extension-by-consent into the original text; a revival remains one announcement away | Toward NO | Moderate |
The Scenarios
BASE — Muddle at ninety · 42%
No successor deal, but no new theatre of escalation either. The stalemate that has held since the March spike persists: rerouting, drawdowns and demand response keep the physical market supplied at a premium that stays in the $85–99 band. The window maximum stays below $100. This is the scenario the futures curve itself is closest to pricing.
BREAK — The hundred prints · 36%
The post-expiry risk premium compounds — tanker insurance, a targeted vessel, a failed back-channel — and spot grinds or gaps through $100 without a full military escalation. The maximum lands between $100.00 and $114.99. Note how little this requires: from $93.26, a 7.2% move in thirty days, in a market realising 78% annualised volatility.
TAIL — March redux · 22%
Strikes widen — against Iranian infrastructure, or the threat against Oman materialises in any form — and the market re-runs the February–March repricing. Spot revisits $115 or higher; the March record of $138 on this series bounds the plausible extreme.
The Monte Carlo
Fifty thousand paths, seed 20260819, thirty trading days. Three correlated drivers — a drift shock, a volatility multiplier and a jump-intensity driver — share a Gaussian copula (correlations 0.45–0.60); daily innovations are Student-t (ν=4); the political state is drawn per path from a Dirichlet over de-escalation / stalemate / escalation centred on 25/50/25, so the contested input is stochastic rather than assumed. De-escalation paths carry a one-time downward reprice of 8–22%.
The variance budget is measured, not asserted. Total 30-day dispersion is pinned to the closure-period realised 30-day change dispersion (0.2956 in logs) by numerically closing a scale factor κ on the model's own output: κ = 0.742, simulated dispersion 0.2973 — a 0.6% gap, printed by the run itself.
| Output (95% CI) | Value |
|---|---|
| P(any print ≥ $100) | 64.9% ± 0.4% |
| BASE / BREAK / TAIL | 35.1% / 29.9% / 35.0% (± ~0.4% each) |
| Barrier ladder: $95 / $105 / $110 / $115 | 82.1% / 52.5% / 42.8% / 35.0% |
| End-September distribution (p5–p95) | $61 – $160, median $95 |
| Touch probability by regime | de-escalation 28.5% · stalemate 69.8% · escalation 91.2% |
| Anchor sensitivity (start $91 / $95) | 58.4% / 70.5% |
| Specification envelope (9 legs, κ re-closed per leg) | 54.5% – 71.4% operative (a degenerate full-history leg at 24.9% is disclosed and excluded) |
The envelope's degenerate leg pins the budget to full-history dispersion (0.1464), under which the structural regime spread alone exhausts the budget and κ floors at zero; it is disclosed at 24.9% and excluded from the operative range. The operative floor is the last-60-session budget leg at 54.5%; a curve-consistent leg applying a −3%-per-30-day stalemate drift (the backwardation's direction, pending strip data) prints 60.6%.
Reconciliation. Desk 58% · model 64.9% · driftless reflection proxy at budget volatility 81.3% · high-volatility historical base rate 61.3%. Desk split 42/36/22 against the model's 35.1/29.9/35.0. Deltas: Desk − model = −6.9pp; Desk − proxy = −23.3pp; Desk − base rate = −3.3pp. The Desk sits below its own model because the closure-period variance budget over-weights the February–March shock phase — dispersion realised while the market was discovering the closure, not while living with it — and because the backwardated curve embeds a downward central path the simulation's stalemate drift does not fully honour.
Market vs. Desk View
A driftless barrier read at realised closure volatility says 81% — buy the touch. The Desk says 58%. The gap is deliberate and it is the edition's judgment call: realised volatility is a shock-era artefact; the forward curve, the demonstrated supply-side adaptation since March, and the extension-by-consent clause all argue the market absorbs the expiry the way it absorbed the closure itself. Against that, the political surface is worse than at any point since March — the mediator is now itself a target of rhetoric. If you believe repricing happens in jumps rather than grinds, the Desk's 22% tail is the number to argue with, not the 58%.
The Universal-Owner Portfolio Read
A $100 print inside six weeks is not, for a universal owner, an energy-sector event. It is an inflation-expectations event first: breakevens widen, the disinflation narrative that had markets debating cuts gets another oil-shaped hole, and the policy path reprices toward higher-for-longer everywhere at once — equities, duration and credit correlate exactly when diversification is needed most. It is a fiscal-flows event second: Gulf producers pumping into a $100 tape run larger surpluses, and sovereign wealth inflows accelerate precisely as oil-importing pension systems in Europe and Asia absorb the terms-of-trade hit — capital-flow asymmetry between allocator regions widens. Third, it is a liability event for insurers, whose inflation-linked liabilities reprice faster than their asset books. The hedges that matter are the boring ones: energy equity and commodity-carry overweights held through the noise, real-asset inflation pass-throughs, and an honest audit of how much disinflation the portfolio's private-market marks quietly assume.
Second- and Third-Order Effects
Second order: tanker rates and war-risk premia feed goods inflation with a one-quarter lag; Asian refiners bid harder for Atlantic-basin barrels, tightening the very series this question grades on; energy-importing EM currencies weaken against the dollar, tightening financial conditions without a single central-bank meeting. Third order: a $100 print revives strategic-reserve politics in Washington into the midterm season; accelerates the LNG-for-crude substitution bid in Europe's winter book; and hands every energy-transition investment committee a fresh argument about hedging the transition with the incumbent — expect the stranded-asset debate to go quiet for a quarter. If instead the deal is revived, the de-escalation reprice (the model carries 8–22% down) lands hardest on the levered length that arrived after 17 August.
Watch Dashboard
| Signal | Threshold that changes the weights |
|---|---|
| Daily Hormuz transits | Sustained move above ~10/day → shift toward BASE; a week at zero → toward BREAK |
| Any strike touching Omani territory or assets | Immediate TAIL re-weight above 30% |
| Announced resumption of talks / new memorandum | BASE above 55%; expect the one-time downward reprice |
| Brent prompt spread (backwardation depth) | Steepening past the March extreme → physical stress the spot series will print |
| Tanker war-risk premia, Gulf routes | A doubling from mid-August levels → BREAK becomes the modal scenario |
| DCOILBRENTEU itself | A $96 print before 1 September puts the barrier ~4% away with 4 weeks left |
Red-Team — How This Could Be Wrong
The anchor is stale. The grading series publishes with a lag; the last print is 11 August. If spot has already moved to $96–97 behind the futures rally, today's 58% is materially too low — the anchor-sensitivity row exists for exactly this reason, and $95 starts read 70.5% in the model. The budget may be the wrong regime. Pinning dispersion to the full closure period imports the March discovery shock; the last-60-session leg says 54.5%, and if the market has genuinely learned to live with the closure, even that overstates. The priors are judgment. 25/50/25 across de-escalation/stalemate/escalation is the Desk's read of a presidency that signed one interim deal already; a reader who thinks the Oman threat is theatre should push de-escalation up and watch the number fall — the 35/45/20 envelope leg prints 59.7%. Spot–futures wedge. The question grades on a spot series that has run $2–3 above front futures; a convergence from the spot side flatters NO. And the deal can simply come back. Both capitals wrote mutual-consent extension into the text; the fastest path to a NO is a photograph of two negotiators.
Methodology Box
Question graded on EIA Europe Brent Spot Price FOB, daily, as published on FRED (DCOILBRENTEU); data vintage: observation start 2 January 1990, last observation 11 August 2026 ($93.26), n=9,284. Monte Carlo: n=50,000 paths, 30 trading days, seed 20260819 (the run date), NumPy. Correlated drivers via Gaussian copula; Student-t(4) daily innovations; Dirichlet-stochastic political regime; Poisson upside jumps with lognormal sizes; one-time de-escalation reprice. Total horizon dispersion pinned to the closure-period realised 30-day change dispersion by a numerically closed scale factor (κ=0.742), verified on simulated output (0.2973 vs 0.2956). Historical base rates computed on the same series, 1990-forward, volatility-conditioned. Specification envelope: nine legs varying tail thickness, regime priors, jump structure, a curve-consistent stalemate drift and the variance-budget target, κ re-closed per leg. Scenario weights are the Desk's judgment, reconciled to the model, the market proxy and the base rate above. Monte-Carlo sampling error at the headline: ±0.4% at 95% confidence.
The Probability Desk publishes probability-weighted scenarios for long-horizon institutional readers. Probabilities are estimates under stated assumptions, not guarantees, and nothing here is investment, legal or tax advice. Forecasts are graded publicly against the named official series when the window closes.
Source Ledger
- Crude Oil Prices: Brent — Europe (DCOILBRENTEU) — FRED, Federal Reserve Bank of St. Louis (grading series; data pulled via the FRED API, last observation 11 Aug 2026)
- Deadline to reach US–Iran deal expires, Trump threatens Oman — CNN live coverage, 17 Aug 2026
- US–Iran Memorandum of Understanding expires: how and why it fell apart — Al Jazeera, 17 Aug 2026
- Trump threatens Oman, Hormuz Strait traffic slows, Iran ceasefire ends — CNBC, 17 Aug 2026
- Stalemate on the strait as deadline for US–Iran agreement expires — The National, 16 Aug 2026
- Oil prices rise as U.S. threatens 'economic isolation' of Iran — CNBC, 14 Aug 2026
- Oil prices, stocks surge as Hormuz closure drags on — Al Jazeera, 10 Aug 2026
- Brent tops $89 amid U.S.–Iran stalemate over Hormuz — OilPrice.com
- Short-Term Energy Outlook — U.S. Energy Information Administration
|
|
|
|
|
|
|
|
|