Why it matters
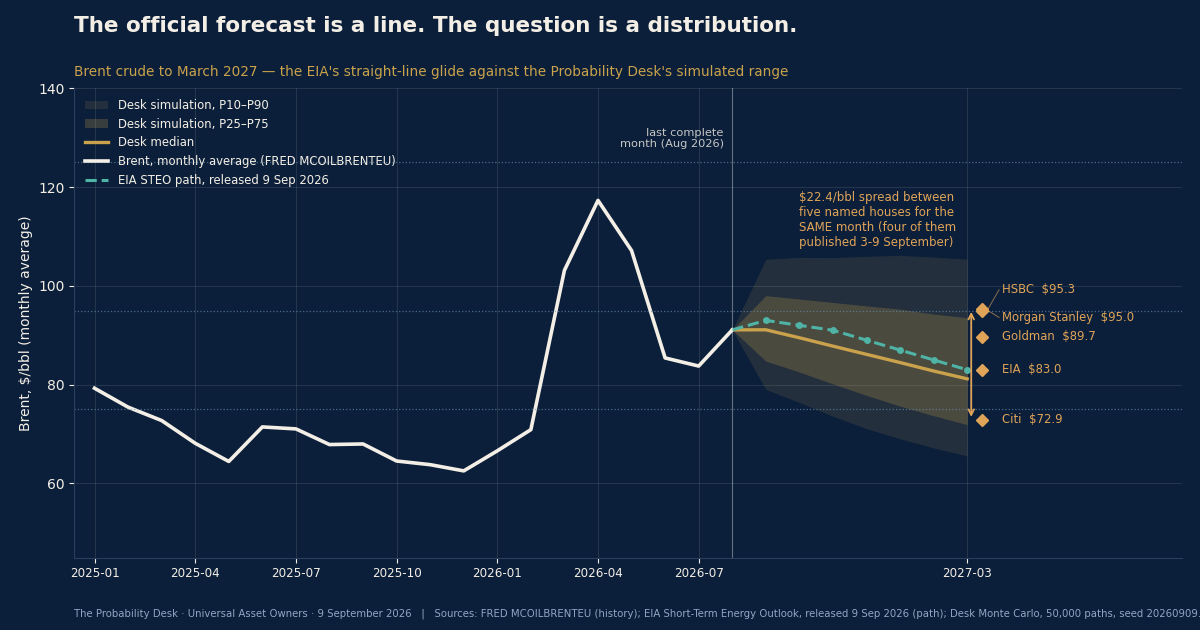
The U.S. Energy Information Administration published its Short-Term Energy Outlook this morning and put Brent at $83 a barrel in March 2027. The full path it published — $93 in September, then $92, $91, $89, $87, $85, $83, and on down to $62 by December 2027 — is fifteen consecutive monthly declines, ten of them exactly $2. It is a straight line, and by construction it cannot represent the only thing that matters: whether the Strait of Hormuz reopens, when, and on what terms.
The teal dashed line is that official path. The gold band is the Probability Desk's simulated range, 50,000 paths built around the transit-recovery path rather than around oil. The amber diamonds are five named houses — Citi, the EIA, Goldman Sachs, Morgan Stanley and HSBC — publishing a forecast covering the same month, four of them within a single week of each other. Only the EIA published a March figure; the other four are annual or quarterly averages, and putting all five on a common March basis leaves them $22.40 a barrel apart. The printed numbers themselves span $30.
That spread is the chart. It is not a disagreement about demand, or about OPEC+, or about the shale response. Every one of those houses is looking at the same barrels. They disagree about a waterway. Hormuz liquids traffic is running near 8 million barrels a day against a pre-war baseline of 19.87 million, and on 26 August Iran and Oman agreed a temporary corridor through Iranian waters in which an IRGC spokesperson said the two countries had settled their "share… in its revenues."
The Desk's median, $81, sits two dollars below the EIA's. We are not contrarian on the middle. We are contrarian on the width: we put 35% of the probability at or above $95, and a point forecast puts none of it anywhere.
Sources: FRED MCOILBRENTEU (history); EIA Short-Term Energy Outlook, released 9 September 2026 (path and the $83 March figure); Vortexa via Axios, 4 September 2026 (transit); IEA Strait of Hormuz factsheet, February 2026 (baseline); Al Jazeera, 26 August 2026 (the corridor); Citi 3 Sep, Goldman 7 Sep, HSBC 8 Sep, Morgan Stanley note 23 Aug (the forecasts). Desk Monte Carlo, 50,000 paths, seed 20260909; mc.py ships with today's full report.
Read the full scenario
Editorial scenario analysis only. Not investment, actuarial, or geopolitical advice.
Continue the briefing. Read the daily brief · watch the daily video briefing · listen to The Universal Owner · view the chart of the day.
Produced and edited by the UAO editorial desk. Not investment advice.