
Universal Asset Owners · Daily Brief · Friday 31 July 2026
A Headline Yield Is Not a Liability Curve
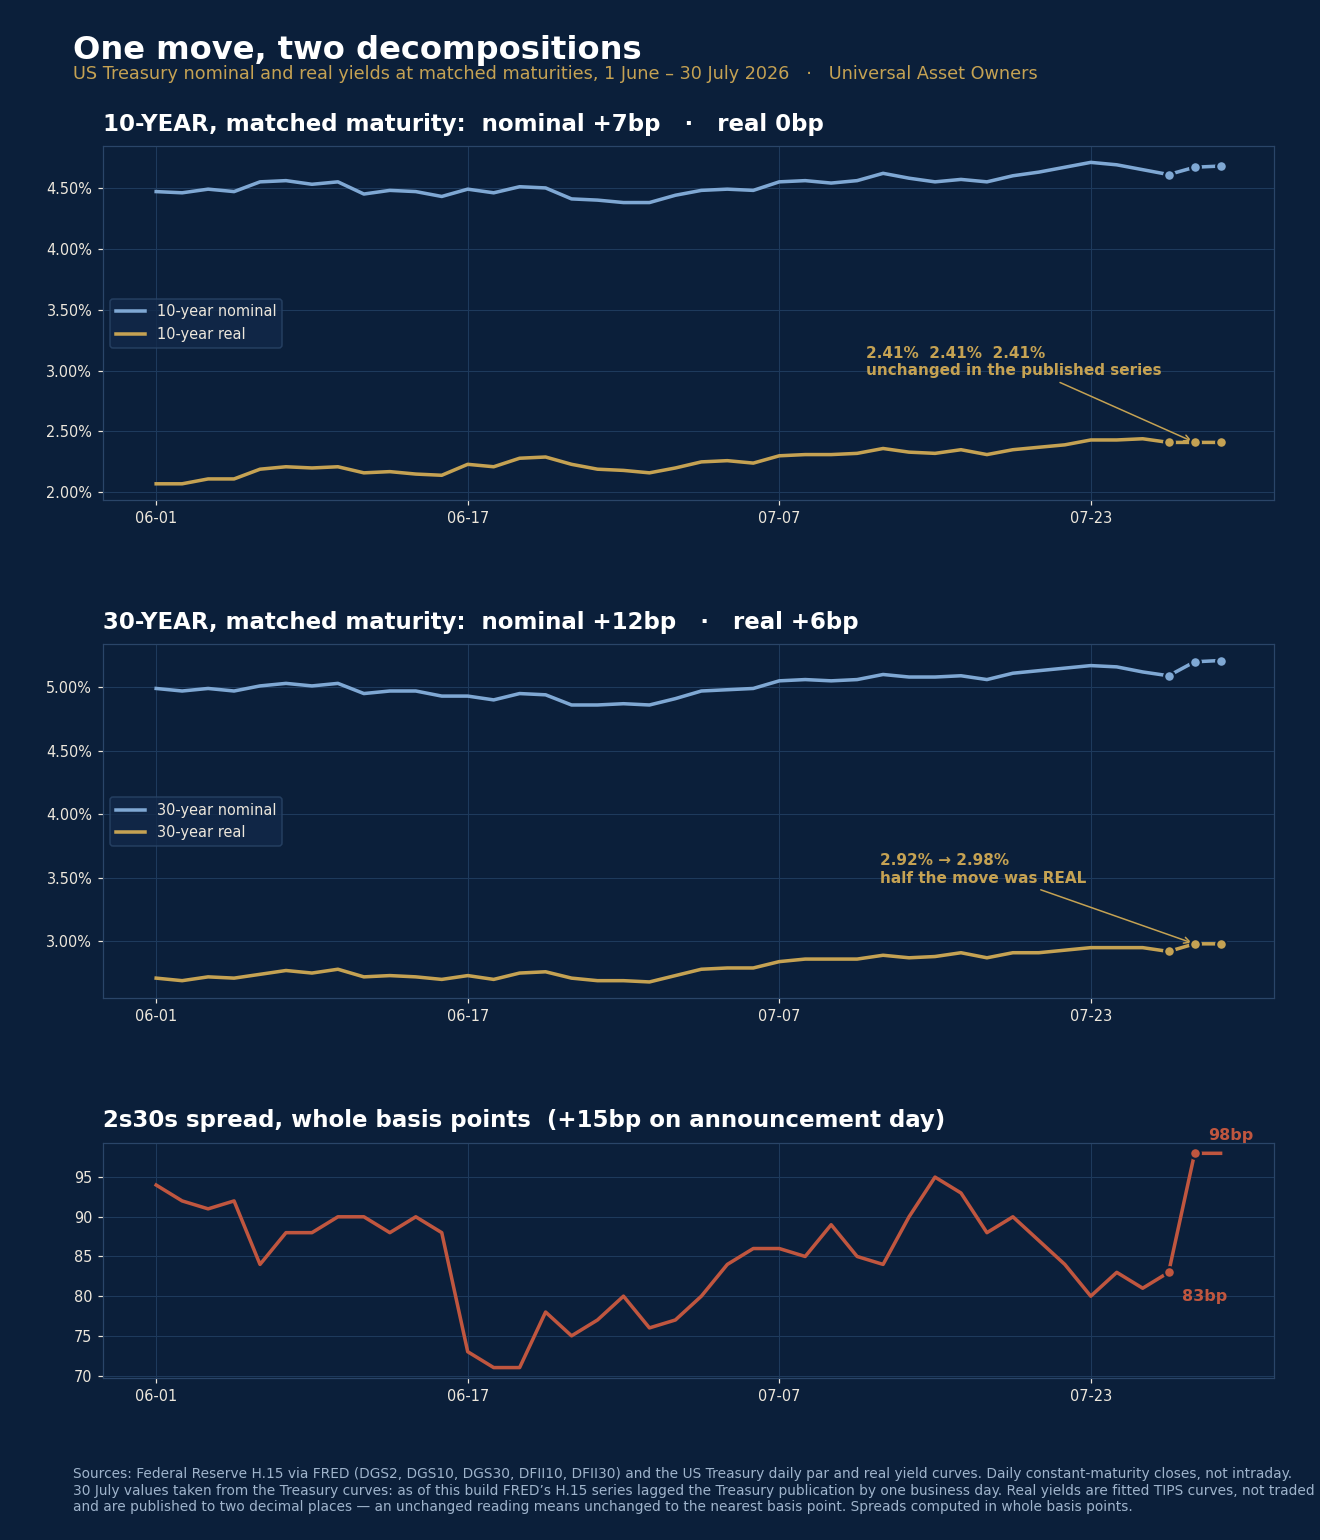
Over three sessions the 10-year Treasury yield rose seven basis points with the published real yield unchanged, while the 30-year rose twelve with six of them real. One move, two decompositions — and neither of them prices a sterling pension promise.
If you read nothing else
1. At 10 years, nominal rose 7bp and the published real yield was unchanged at 2.41%. At 30 years, nominal rose 12bp and real rose 6bp. The decomposition changed with the maturity.
2. A US Treasury move is not the ASC 715 corporate discount curve, and it is not a sterling gilt curve. It cannot tell you what happened to a UK scheme's funding position.
3. We tested whether a sharp steepening predicts the real yield. It does not: 57.1% of episodes against an unconditional 50.3% — a 6.8pp lift, inside its own confidence interval. We are publishing the null.
01 · The Briefing
Today in two minutes
Two minutes on the day.
02 · The Lead
One move, two decompositions
The Treasury curve steepened hard on the Federal Reserve's announcement day. There was no single real-rate answer across it.
On Tuesday 28 July, the first day of the Committee's meeting, the two-year closed at 4.26% and the 30-year at 5.09% — a spread of 83bp. On Wednesday, when the Committee held its target range at 3‑1/2 to 3‑3/4 percent, the two-year fell four basis points and the 30-year rose eleven, widening the spread to 98bp. It stayed at 98bp on Thursday, when the 30-year closed at 5.21% — its highest close since 12 July 2007. Treasury par curve · FOMC statement
A one-day 2s30s steepening of 15bp or more is uncommon. Computing in whole basis points across the Federal Reserve's H.15 history, it has happened 157 times in 12,357 day-to-day comparisons — 1.27%. DGS30 · DGS2
The part that matters: the decomposition changed with the maturity
| Maturity | 28 Jul nominal | 30 Jul nominal | Δ | 28 Jul real | 30 Jul real | Δ |
|---|---|---|---|---|---|---|
| 10-year | 4.61% | 4.68% | +7bp | 2.41% | 2.41% | 0bp |
| 30-year | 5.09% | 5.21% | +12bp | 2.92% | 2.98% | +6bp |
At 10 years the whole move was inflation compensation. At 30 years, roughly half of it was real. Treasury real curve · DFII10 · DFII30
Two disciplines before anyone builds on that. These series carry two decimal places, so three readings of 2.41% establish that the ten-year real yield was unchanged in the published series to the nearest basis point — not that the underlying market yield moved by exactly zero. And a breakeven is not expected inflation: it is nominal minus real, and it also carries an inflation-risk premium, TIPS liquidity effects, and the relative supply of indexed versus nominal paper. “Inflation compensation” is the honest term.
Why the maturity is the whole story for an asset owner
No serious institution values a liability off one point on one curve.
A US corporate defined-benefit plan measures its obligation under ASC 715 against a high-quality corporate bond curve matched to its projected benefit payments. A Treasury move is evidence about Treasuries; it does not establish what that corporate curve did. A UK scheme assesses sterling liabilities against gilt and market-implied inflation curves. A US Treasury yield cannot tell you what happened to a sterling pension promise — different currency, different curve, different indexation rules.
So the question is never “did rates rise.” It is four questions:
- Which curve prices the liability — currency, credit quality, and the maturity points matching the benefit cash flows?
- Which curve prices the hedge — and is it the same one?
- What did the assets do over the same window?
- What did the collateral do — because a liability that falls in value while long bonds fall in price can produce margin calls, not relief.
An honest statement of this week's liability effect is narrow. For an isolated liability of fixed nominal cash flows, present value generally falls when the matched same-currency nominal discount curve rises. For fully inflation-linked real cash flows, present value is broadly unchanged when the matched real curve is unchanged. Everything past that depends on the scheme's assets, currency, duration, caps and floors, valuation regime, collateral and hedge design.
Chair Warsh was right, and the interesting point is narrower
“nominal and real yields are materially higher across the Treasury curve. In fact, some of the increases in market interest rates between FOMC meetings are among the most significant in the last two decades, ranking around the top decile or so.”
FOMC press conference transcript, 29 July 2026
He was describing the intermeeting period. Over it he is straightforwardly correct: from 17 June to 29 July the 10-year real yield rose 18bp (2.23% → 2.41%) and the 30-year real rose 25bp (2.73% → 2.98%), alongside nominal rises of 18bp and 27bp. Both halves of his statement are in the data.
The narrower observation worth having is this: in the final three sessions of that 42-day move, the two real curves stopped agreeing. The ten-year real yield paused while the thirty-year kept going. That is a statement about the shape of the move, not a correction of anybody — and it is the kind of thing a liability-matched investor notices and a headline does not. He also offered a mechanism unrelated to inflation: having withdrawn forward guidance, “market participants are learning to play the ball, not the referee.”
The dissents
The hold was 9–3. Hammack, Kashkari and Logan each preferred a quarter-point increase. Supporting rates: interest on reserve balances 3.65%, primary credit 3.75%, overnight reverse repo 3.50% at $160bn per counterparty. Implementation note Three hawkish dissents would ordinarily lift the front end. The two-year fell four basis points.
03 · Capital Moves
Sovereign, pension and capital moves
Each item supported by a first-party filing, company release, adviser announcement, regulator or official record, as identified.
Three UK pension risk-transfer announcements totalling £538m were published on 29–30 July, with differing completion dates.
- Aviva — £180m full buy-in with the Aston Martin Lagonda Pension Scheme, 540 pensioners and 1,050 deferred members. Aviva release
- Royal London — £208m bulk annuity with the Hickson UK Group Pension Scheme, over 1,250 members. Sourced to the adviser, not the issuer: Mayer Brown
- M&G — £150m buy-in for roughly 1,200 members under a “BPA Plus” structure offering the potential for with-profits participation. Announced 29 July; transaction completed in June. M&G
A rare disclosed price comparison. Graham Holdings disclosed a $113.9m premium against $124.3m of obligations removed under the company’s own accounting measurement, filed 30 July for a 17 June transaction. The filing also records a $137m settlement gain. This is a transaction-specific disclosure, not a portable market-price multiple — the obligation is measured on a particular discount-rate and mortality basis. SEC filing
UK collective money purchase. The multi-employer collective money-purchase regime and its associated regulatory code take effect on 31 July. A regime commencing is not a scheme beginning to operate. legislation.gov.uk
Korea’s National Pension Service disclosed fund assets of KRW 1,848.7 trillion and a 26.18% return for January–May. No FX conversion applied; return period and preliminary status as published. NPS
Stewardship expressed through manager selection. Nesta Trust moved £120m — more than a quarter of its £420m endowment — from Northern Trust to Amundi. Nesta’s stated reason is Northern Trust’s exit from Climate Action 100+ and the Net Zero Asset Managers initiative; that is Nesta’s characterisation, not our assessment of Northern Trust. Disclosed 29 July; assets moved in June. Nesta
Asset owners on the record with a regulator. The New York City Comptroller, for the five NYC retirement systems ($328.87bn), and the Council of Institutional Investors submitted comments opposing the SEC’s rescission of its climate-disclosure rule on 29–30 July. CII describes its membership as holding some $5.6tn — CII’s own characterisation, not a figure from the letter. SEC comment file
Household credit leaves a bank balance sheet. HSBC agreed to sell its A$36bn (US$25bn) Australian home- and personal-loan portfolio to Blackstone, Pepper Money servicing, completion expected H1 2027 subject to approval. Signed, not closed. HSBC announcement
Also: Oxfordshire Pension Fund committed £10m to a Resonance homelessness-property fund (sourced to the fund manager) — Resonance. Equitable and Corebridge holders approved their merger 30 July; Corebridge counted 366,176,877 for, 119,470 against — SEC 8-K.
Three ways asset owners moved risk this week
Transfer — UK schemes moved longevity and investment risk to insurers through buy-ins.
Pool — the collective money-purchase regime creates a framework for sharing longevity and investment outcomes across cohorts instead.
Reassign — Nesta used manager selection to express a stewardship preference.
Three different answers to the same question: who should carry it?
04 · AI Wealth
When private marks reach a city’s tax base
Every figure carries its own health warning.
The headline number is a thought experiment, and its author says so. Redfin calculated on 9 July that current and former OpenAI and Anthropic employees could buy 29% of all homes in the San Francisco metro with post-tax IPO proceeds — describing it as “purely hypothetical and not a realistic representation of where IPO proceeds will go.” Estimated post-tax employee equity $135bn and $63bn; no tax rate disclosed; employees assumed to hold 10–15% of Anthropic. Redfin
There is no IPO. Both filed confidentially — Anthropic 1 June, OpenAI 8 June — with no share count and no price. OpenAI’s last disclosed valuation was $852bn; Anthropic’s last round $965bn, reaching $1tn only on secondary-market trades, which is a price some holders accepted rather than a valuation the company set. OpenAI
These are private companies. They are not public-equity holdings and cannot be top constituents of an index portfolio. The exposure reaches an institutional balance sheet indirectly: listed suppliers, utilities and data-centre infrastructure; private-markets marks; venture and growth holdings; labour costs; regional housing credit; and municipal tax bases.
Two housing medians circulate and both are right, because they measure different things. SF city, single-family: $2,128,000 in June, −3.3% on the month, +24.8% on the year (C.A.R.). SF metro, all homes: $1,725,000, +9.2% year on year (Redfin). Quoting either as “the San Francisco median” without the definition is how a real number becomes a wrong one. Rent: $4,034, Zumper’s June asking-rent measure (Zumper). We omit any vacancy rate — the “3% in prime districts” figure traces to no measured series.
The better question. Not “could employees buy 29% of the housing stock,” but: what happens when a city’s housing, wage and municipal-revenue outlook becomes sensitive to private marks set by a handful of companies? Model it at 5%, 10% and 20% realised liquidity rather than full conversion, then apply local employee share, after-tax proceeds, lockups, and geographic retention. That turns a publicity statistic into a housing, municipal and labour-market scenario.
05 · Risk Radar
Universal owner risk radar
What is moving, and where it is sourced.
- Uto, Japan earthquake — USGS PAGER alert red. Mww 6.8 at 10 km. PAGER is a modelled impact product: modelled maximum intensity MMI 9.24, modelled PGA 0.898 g, 1.2m people modelled at MMI ≥ VII — not observed casualties or damage. A nearby M5.0 aftershock followed on 30 July. USGS · aftershock
Why: second-tier supplier concentration and property-catastrophe underwriting. Production-suspension reports circulating on wires are unverified here and excluded. - Saumos, France — GDACS red wildfire alert. 47,895 ha and 11,670 people are automated alert-system estimates, not confirmed loss totals. Copernicus activation EMSR899. GDACS
- Central Spain — GDACS orange. 66,098 ha, 20,200 people, same modelled caveat. EMSR900. GDACS
- CISA KEV v2026.07.29 — CVE-2026-16812, Arista VeloCloud Orchestrator On-Prem. Vendor/CNA severity 10.0. The 30 July remediation date binds US federal civilian agencies under the KEV directive — it is not a universal legal deadline. NVD · KEV
The decision-useful question: which portfolio companies operate this product, is it internet-reachable, who owns remediation, and does cyber cover exclude known-but-unpatched vulnerabilities? - Market stress. HY OAS 2.68% → 2.87% over five sessions to 29 July; VIX 16.64 → 20.66; St Louis Fed Financial Stress Index −0.8263 for the week ending 24 July — a weekly composite, so it cannot show you a Wednesday. STLFSI4
06 · Week Ahead
The high-signal three
What would change the picture.
- Commentary versus filed cash flow. Amazon’s release shows trailing-twelve-month free cash flow at −$7.6bn, from +$18.2bn, with AWS revenue $42.2bn, up 37%. The widely-quoted $220bn capex and $496bn backlog figures were given in management commentary on the earnings call — a primary management statement, though not a filed figure — and do not appear in the cited 8-K exhibit. The disclosed cash line is TTM purchases of property and equipment of $173.0bn gross / $169.0bn net, excluding $4.0bn of finance-lease additions. Watch the 10-Q to reconcile them. 8-K exhibit
- Inventories versus prices — EIA, 5 August, 10:30 ET. US commercial crude ex-SPR at 404,508 kbbl for the week ending 24 July, the lowest since September 2018, and Cushing at 18,599 kbbl, lowest since August 2014. Low US inventories are not by themselves evidence of global physical tightness. Both benchmarks peaked 23 July (Brent $105.32) and the latest observation of any kind is 27 July: Brent $91.82, WTI $84.25 — down 12.8% and 9.5% from the peak. From 30 June ($70.46) Brent is +30.3%; from 1 July ($69.24), +32.6%. We state the base date with the number. EIA · schedule
- Central banks that held with dissent. The Bank of England held Bank Rate at 3.75% on a 6–3 vote — Greene, Mann and Pill for 4.0% (BoE minutes). The Bank of Japan held at about 1%, 8–1, Takata for 1.25% (BOJ). China’s July manufacturing PMI fell to 49.2% from 50.3, with non-manufacturing activity at 49.0% (NBS). US Q2 GDP advanced at +1.5% annualised, from 2.1% (BEA).
07 · The Allocator Lens
Four reconciliations, and a basis question
What to actually ask for.
One table, four rows — every row names a currency and an index
| What to list | The trap | |
|---|---|---|
| Liabilities | By currency, inflation index (RPI/CPI/none), key-rate duration, caps and floors | A group-level “funded status” line aggregating across currencies means nothing |
| Nominal hedge | By currency and maturity bucket | Hedging a sterling promise with dollar duration |
| Real / inflation hedge | By index and maturity bucket | Hedging an RPI promise with a CPI instrument |
| Collateral & liquidity | Requirement under a parallel and a non-parallel curve shock | The non-parallel shock is what happened this week |
The board question is not “how much duration do we have.” It is: where is our largest unhedged basis — currency, index, curve or maturity? Gross duration is in every report. Basis mismatch is what hides.
Credit and volatility, with windows named. On announcement day (28→29 July) high-yield spreads moved 2.84% → 2.87%, 3bp, while VIX moved 18.21 → 20.66, +13.5%. Over the five sessions from 22 to 29 July, spreads widened 2.68% → 2.87% (19bp) and VIX rose 16.64 → 20.66 (+24.2%). HY OAS · VIX
Whether that means “credit has not yet marked” is an interpretation, and there are at least three others: the rates move may be a Treasury term-premium and supply event with no credit content; equity volatility may be responding to a different catalyst; or spreads may be technically anchored by index demand. Each has a falsifier, and we will report which one fires.
Rights note: ICE BofA index redistribution permission is unconfirmed. We quote levels with FRED attribution and as-of dates and are not charting the series until that is resolved.
08 · Toolkit
Today’s toolkit
The reproducible monitoring stack. The same feeds we use.
Rates and inflation
DGS2 · DGS10 · DGS30 · DFII10 · DFII30 · T10YIE · Treasury par curve · Treasury real curve · H.15 documentation · FOMC statements · BoE · BOJ
Macro and energy
EIA weekly · EIA calendar · Brent · WTI · BEA GDP · China NBS · Japan MOF intervention
Risk and systems
HY OAS · STLFSI4 · VIX · USGS PAGER · GDACS · CISA KEV · NOAA SWPC
Further reading
The Treasury’s yield curve methodology, which explains why a real yield is a fitted curve rather than an observed price — the single most useful page behind today’s lead.
09 · Standards
How we verify — and what we refused to print
The reasoning is more useful than the items.
How we verify
- All draft material is treated as untrusted until checked against primary sources: official transcripts, data tables, and institutional reports.
- We hold issues that depend on numbers we cannot reconstruct, citations we cannot authenticate, or allegations without proper rights of reply and governance approval.
- We elevate to a forensic standard for original research, serious allegations, disputed events, or claims capable of institutional harm.
10 · The Back Page
Meet The Allocator
Our resident chief investment officer, who has read the footnotes so you don’t have to.
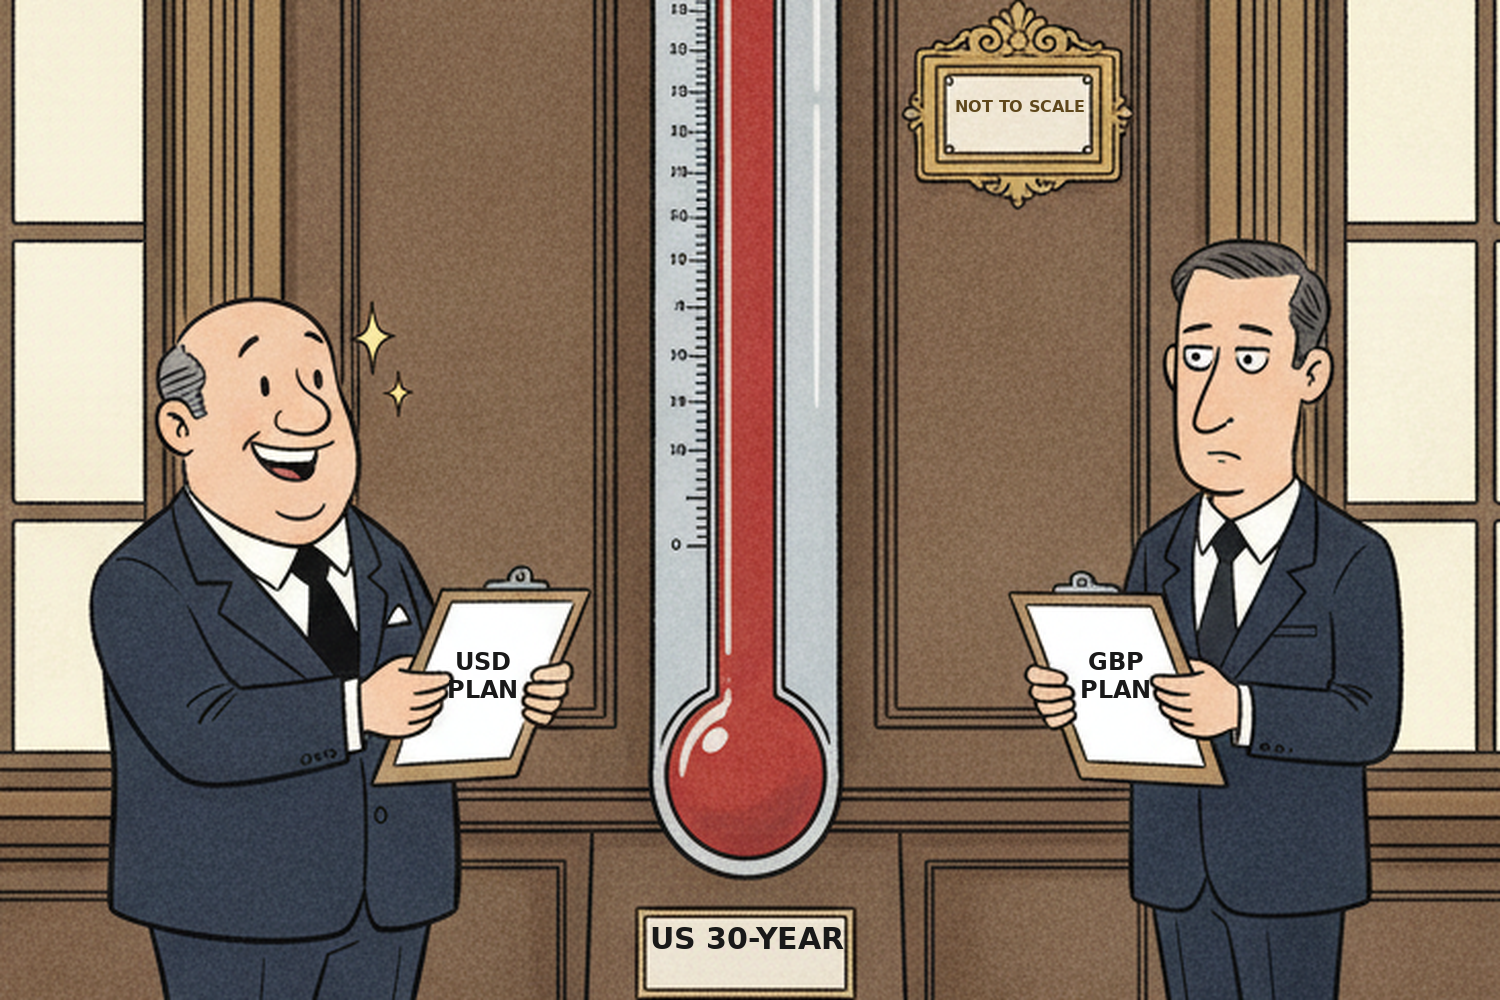
The Allocator’s question this week: someone will bring you a number showing the funding level improved. Before you write it down, ask which curve it came off, and in which currency. If the promise is sterling and the gauge is a US Treasury, the improvement is somebody else’s.
11 · What To Do
What a universal owner does with this
Governance, portfolio, monitoring.
Governance. Require that every funded-status figure names the curve, the currency and the maturity points behind it before it reaches a committee paper.
Portfolio. The exposure is the basis, not the move. Build the four-row table in section 02 and find the largest unhedged basis — currency, index, curve or maturity.
Monitoring. Pull the Treasury par and real curves alongside FRED, because FRED’s H.15 series lagged by a business day as of this build. Compute spreads in integer basis points. And compute the unconditional base rate beside any conditional one.
If you only do one thing before the next meeting
Produce a one-page map: discount-rate regime by plan section, hedge instruments by regime, and the share of positions where a nominal instrument hedges a real promise in a different currency. That single page tells you whether this week was relief, basis risk, or nothing at all — and no market commentary can tell you instead.
12 · Podcast & Scenario
Listen, and run it on your own book
The episode, and today’s interactive scenario.
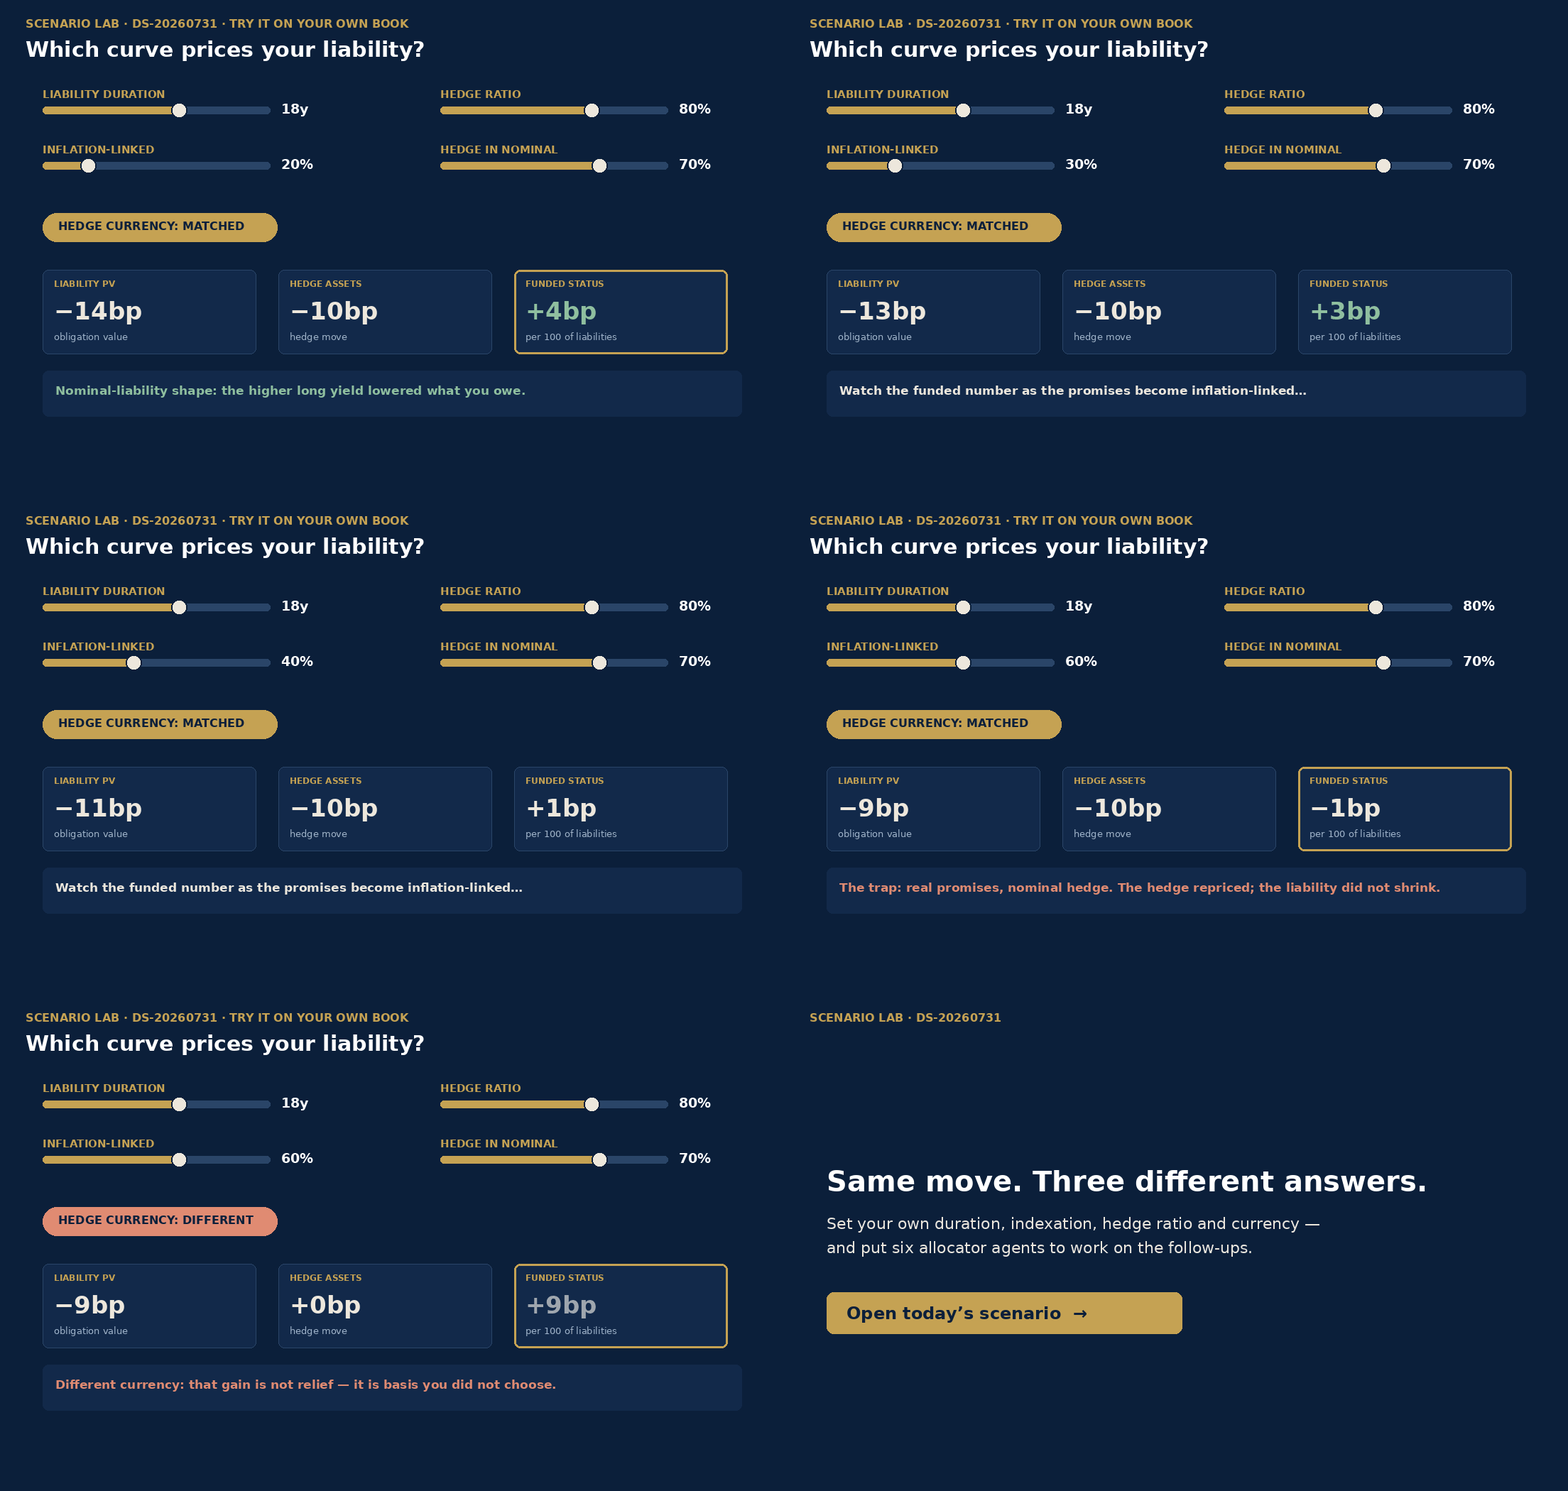
Scenario Lab · DS-20260731
Which Curve Prices Your Liability?
Six allocator agents, a 14-node causal map, and a trigger monitor with no forecast attached — because the conditional lift is inside its own confidence interval.
13 · Careers
Investment roles at the funds we cover
Verified open positions at major asset owners.
- Ontario Teachers' Pension Plan — Investment Director, Infrastructure & Natural Resources · Toronto, Canada
- Ontario Teachers' Pension Plan — Investment Associate, Private Capital · London, United Kingdom
- CDPQ — Senior Analyst, Global Equity Markets · Singapore
- CDPQ — Analyste, Placements privés (Analyst, Private Equity) · Montreal, Canada (French-language posting)
- PSP Investments — Senior Analyst/Associate, Credit Investment · London, United Kingdom
- PSP Investments — Associate, Natural Resources Investments · Montreal, Canada
Listings retrieved from each employer’s own applicant system on 31 July 2026. Apply directly at the links above.
Universal Asset Owners — capital at the scale of the world.
The Editorial Team