The Probability Desk · Monday 31 August 2026 · Universal Asset Owners
Desk view in one paragraph
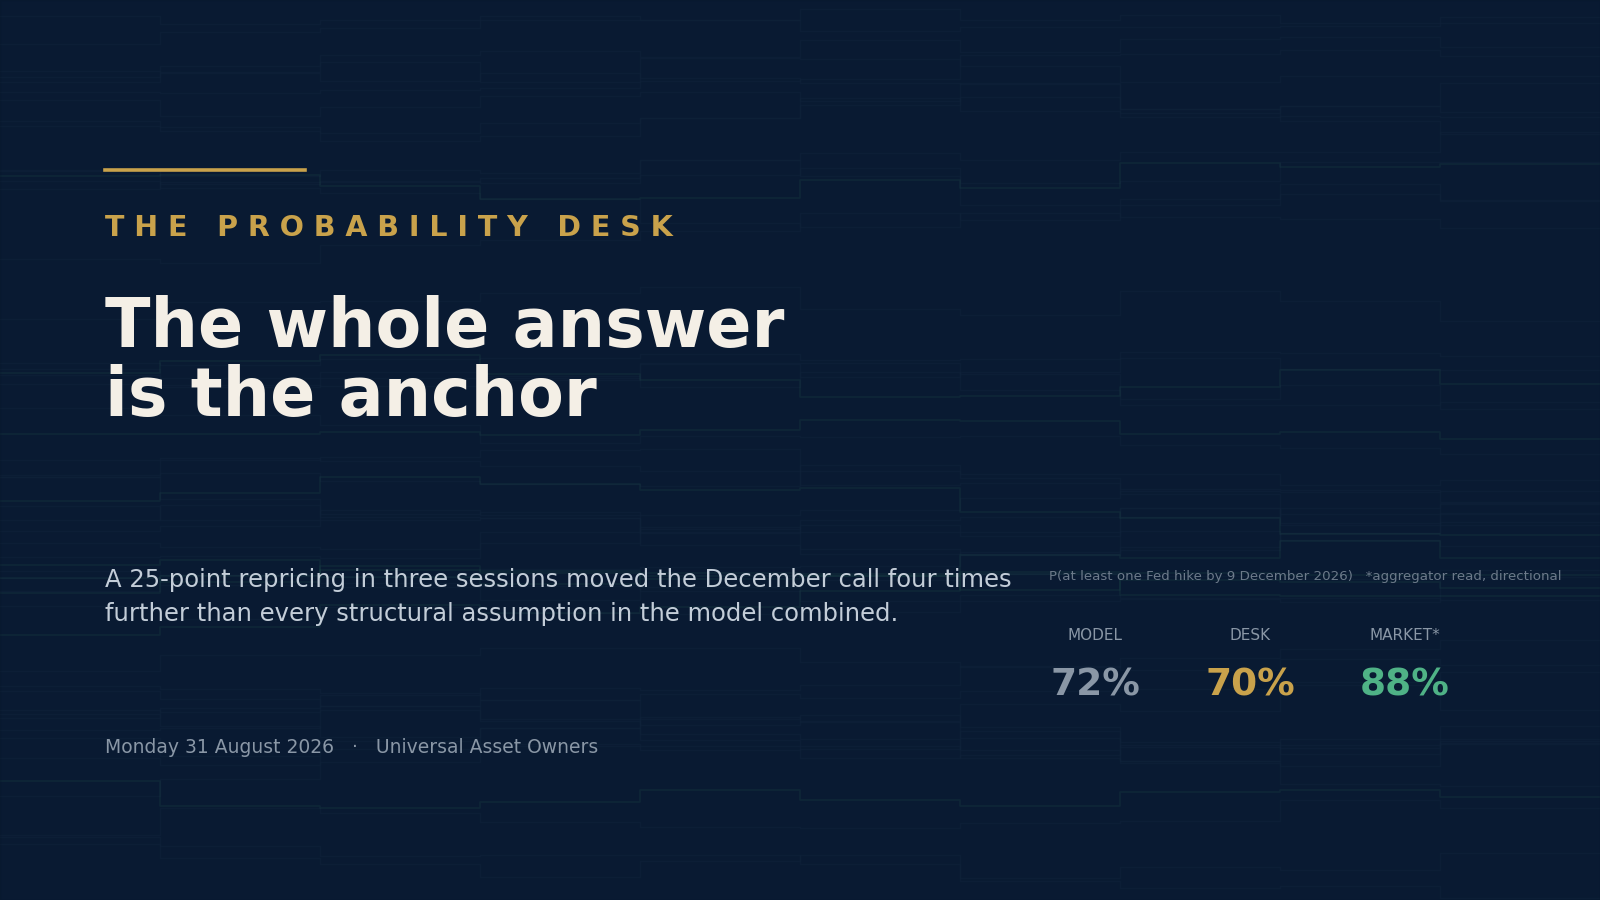
Chair Kevin Warsh used his first Jackson Hole keynote to say that the summer's better inflation prints do not tell him underlying trends have improved, and that he would be "hard pressed to describe broad financial conditions as restrictive." Fed funds futures repriced a September hike from roughly 35 percent before the speech to 60.4 percent by Monday morning. The Probability Desk puts 70 percent on at least one increase in the federal funds target range on or before the 8–9 December 2026 FOMC — below our own model's 75.9 percent and materially below the roughly 88 percent implied by the December meeting's futures-derived distribution. The more useful finding is structural. Re-calibrated across the six September anchors the market has actually printed in the last week, the model returns anything from 48 percent to 89 percent — a 40-point span. Hold the anchor still and vary sixteen structural specifications and the span is 10 points. The single market number the model is calibrated to is worth about four times every structural assumption in the model combined. Part of that is by construction: the hiking threshold is solved to reproduce the anchor, so the anchor is guaranteed some influence. The magnitude is not by construction, and it is the reason this edition leads with it.
The Trigger
On Friday 28 August 2026, Federal Reserve Chairman Kevin Warsh delivered the keynote at the Kansas City Fed's Jackson Hole Economic Policy Symposium, marking, in his words, "my 100th day as Chairman." He was sworn in on 22 May 2026.
Three sentences from the speech carry the repricing.
On the inflation trend: "And while this summer's PCE and CPI readings were better than expected, they do not tell me that underlying trends have meaningfully improved."
On policy stance: "Certain sectors—like housing and agriculture—are showing strains. But, on balance, I would be hard pressed to describe broad financial conditions as restrictive." And: "Credit and loan markets are showing few signs of policy restraint."
On what follows: "We must be confident that underlying inflation is moving to our objective, clearly and at sufficient speed. Otherwise, we have work to do."
The Chair cited the gauge himself: "The Fed's preferred measure of inflation, the 12-month change in the PCE price index, stands at 3.7 percent, while the six-month change is 4.1 percent."
Note the construction. Warsh did not say he would raise rates. The operative language is conditional. What moved the market was not a commitment but the removal of an obstacle: a Chair who will not describe broad financial conditions as restrictive has told you what the debate is now about.
The market's response, in order. Fed funds futures priced a September hike at roughly 30–35 percent before the speech. By Friday midday, CNBC reported "a nearly 56 percent chance of a quarter-point hike in September," with Polymarket at 49 percent. Kalshi's own reading on 29 August was 47 percent for September and 66 percent for a hike at some point before 2027. By Monday 31 August at 07:28 ET, CNBC reported futures traders at 60.4 percent for September, "up from around 56% on Friday." That 60.4 percent figure — verifiable, dated, and prior to this Desk's run — is the number this model is calibrated to.
The rates market moved with it. The two-year Treasury constant maturity went from 4.20 percent on 27 August to 4.34 percent on 28 August, a fourteen basis point jump in a session. The ten-year went 4.67 to 4.73, six basis points. The thirty-year went 5.19 to 5.22. A bear flattener: the front end absorbed almost the whole move, which is what a hawkish policy surprise looks like and what a growth or term-premium shock does not.
The ≤24-hour lead. Over the weekend, US forces struck two Iranian launchers on Larak Island. CENTCOM's Navy Captain Tim Hawkins stated that "Islamic Revolutionary Guard Corps forces were observed preparing to launch rockets with sea mines into the Strait of Hormuz." Brent for September delivery closed Monday at $90.49, up 2.7 percent; WTI settled at $85.76, up 2.8 percent. Iranian media claimed retaliation against US facilities in Jordan; that claim is unverified and is not treated as fact here. The relevance to this forecast is narrow and precise, and it runs against the dovish case: the oil impulse the Committee is arguing about is not fading on schedule.
The Forecast Question
Where will the upper bound of the US federal funds target range stand after the FOMC meeting of 8–9 December 2026?
| Outcome | Meaning | |
|---|---|---|
| A | ≤ 3.50% | net easing — one or more cuts, not offset |
| B | = 3.75% | unchanged from today |
| C | = 4.00% | exactly one 25bp increase |
| D | ≥ 4.25% | 50bp or more of net tightening — two 25bp increases, or one 50bp move |
Resolution. The FOMC statement issued on 9 December 2026, upper bound of the announced target range. Sole arbiter. Mutually exclusive, collectively exhaustive, gradeable on the day.
Starting level. 3.50–3.75 percent, held at the 28–29 July 2026 meeting. Remaining meetings: 15–16 September (with a Summary of Economic Projections), 27–28 October (no SEP), 8–9 December (with an SEP).
The Prior, and the base rate that actually matters
The conventional reference class — how often has the Fed hiked within three meetings of a Chair saying policy is not restrictive — has too few members and too much regime heterogeneity to carry weight. We do not use it, and we say so rather than manufacturing a frequency.
The prior that does carry weight is revealed institutional preference, and it is unusually legible this cycle.
The 29 July 2026 decision was 9–3. The Committee voted to maintain 3.50–3.75 percent. Voting against were Beth M. Hammack, Neel Kashkari and Lorie K. Logan, "who preferred to raise the target range for the federal funds rate by 1/4 percentage point." All three are Reserve Bank presidents — Cleveland, Minneapolis and Dallas — and all three were already at a hike before the Chair's Jackson Hole remarks, before the July PCE print, and before oil re-accelerated.
That is the base rate we anchor the reaction function on, not the market. A committee that arrives at a meeting with three standing hawkish dissents needs to convert roughly two more votes, not eight. The distance to a hiking majority is small and the direction of the Chair's own rhetoric is toward it.
The counter-prior is equally legible. Warsh has been Chairman for one hundred days and has not yet moved rates in either direction. A record of hawkish rhetoric without hawkish action is itself evidence, and the Desk's model is explicitly built to punish the assumption that talk converts.
The Evidence-Update Table
No probability in this report appears without the evidence that moved it. The table below is the audit trail from the pre-speech position to the published call.
| # | Evidence | Date | Direction | Strength | Effect on P(≥1 hike by Dec) | Conf. |
|---|---|---|---|---|---|---|
| 0 | Prior — market-implied September hike ~35%, model union | 27 Aug | — | — | 48.4% | H |
| 1 | Warsh: summer prints "do not tell me that underlying trends have meaningfully improved" | 28 Aug | ↑ | strong | anchor → 56% ⇒ 71.7% | H |
| 2 | Warsh: "hard pressed to describe broad financial conditions as restrictive" | 28 Aug | ↑ | strong | included in above | H |
| 3 | Two-year Treasury +14bp in one session (4.20 → 4.34) | 28 Aug | ↑ | moderate | corroborates the anchor; no independent add | H |
| 4 | Futures at 60.4% for September, "up from around 56% on Friday" | 31 Aug 07:28 ET | ↑ | strong | anchor → 60.4% ⇒ 75.9% | H |
| 5 | July FOMC held 9–3, three dissents preferring a hike | 29 Jul | ↑ | strong | reaction-function prior; supports not shading below ~70% | H |
| 6 | Headline PCE 3.7% y/y, six-month change 4.1% — accelerating | 28 Aug (Jul data) | ↑ | strong | the hawkish datum the oil story cannot absorb | H |
| 7 | Core PCE 3.34% y/y (FRED PCEPILFE, Jul) | Jul data | ↑ | strong | ex-energy inflation is 134bp above target | H |
| 8 | Brent settles $90.49, +2.7%, on Larak Island strike | 31 Aug | ↑ | moderate | oil impulse not fading on the EIA's schedule | H |
| 9 | Core CPI only 2.47% y/y; energy CPI +14.45%, gasoline +24.64% | Jul data | ↓ | moderate | supports the supply-shock read — on CPI only | H |
| 10 | Dallas Fed trimmed-mean PCE "held at 2.3%" | Jul data | ↓ | moderate | the strongest single dovish statistic | M |
| 11 | EIA STEO: Brent $85 Sep → $80 Oct → $78 Nov → $76 Dec; 2027 average ~$69.50 | Aug STEO | ↓ | moderate | quantified below at +0.2pp — the wrong sign for the argument | H |
| 12 | July payrolls −23,000, unemployment 4.1%; May revised +129k→+63k, June +57k→+20k | 7 Aug | ↓ | strong | keeps a genuine easing tail alive | H |
| 13 | Citigroup (Andrew Hollenhorst): "There will not be a consensus to hike rates in September" | 31 Aug | ↓ | strong | −pp on the union | H |
| 14 | JPMorgan Asset Management (David Kelly): markets "may have been premature" | 31 Aug | ↓ | moderate | −pp on the union | H |
| 15 | Goldman Sachs: still sees the Fed on hold in September | ~28–29 Aug | ↓ | moderate | secondary sourcing — low-to-medium confidence | M |
| 16 | Miller Tabak (Matthew Maley): "no empirical basis for the rate hike" | 31 Aug | ↓ | weak | directional only | H |
| 17 | Treasury Secretary Scott Bessent: "traditionally you don't raise into a supply shock… unless you see second- or third-order effects" | 31 Aug | ↓ | moderate | political-pressure leg, now sourced and dated — note the conditional | H |
| 18 | Deutsche Bank: expects 50bp of hikes this year, September and December | 31 Aug | ↑ | strong | +pp on the tail bucket D | H |
| 19 | Bank of America (Aditya Bhave): "the onus is now on Warsh to deliver" — three hikes ahead | 31 Aug | ↑ | strong | credibility-trap argument | H |
| 20 | Nomura: "hawkish remarks… policy may need to react if disinflation is not occurring with speed" | 31 Aug | ↑ | moderate | +pp | H |
| — | Model output at anchor 0.604 | 31 Aug | — | — | 75.9% | — |
| — | Desk published view after items 13–17 net of 18–20 and the anchor-instability discount | 31 Aug | ↓ | — | 70% | — |
Where the Desk sits, and why. Two model numbers must not be confused. The model's bucket view — the like-for-like comparison with our published weights — is C + D = 71.98 percent. The model's path view, P(at least one hike at any point on the path), is 75.9 percent; the 3.9-point difference is paths that hike and then cut back, which resolve in bucket A or B. Our published 70 percent is a bucket number, so the honest statement of our departure is −2.0 percentage points against the model and roughly 18 points below the futures-derived market — not the −5.9 that comparing a bucket number to a path number would suggest. The shading rests on three things and no others: four named institutions on the record within the last twenty-four hours saying there is no September hike; a Treasury Secretary publicly arguing that one does not traditionally tighten into a supply shock — though his own formulation carries the conditional "unless you see second- or third-order effects", which is precisely what is contested; and the plain instability of the anchor — a number that has moved 25 points in three sessions is a momentum reading, not a settled expectation, and momentum readings mean-revert more often than they extrapolate.
What we removed from the shading. The overnight build of this question carried a larger discount, resting substantially on the argument that the Fed is tightening into an oil shock its own energy agency forecasts will reverse before December. We ran that argument through the model rather than asserting it (Fix 5, below), and it moves the union by +0.2 percentage points and the tail by −0.2. The union figure carries the wrong sign for the case it was being asked to make. The reason is mechanical: September is the dominant meeting and it happens before any pass-through decay can bite, so fading the later oil impulse mostly reshuffles mass between the one-hike and two-hike branches rather than reducing the chance of a hike at all. We have withdrawn the weight the argument was carrying. Brent rising 2.7 percent on Monday makes the point twice.
The Scenarios
Weights sum to 100 and are rounded to 5 percent.
A — The Landing Lands · 5%
The labour market cracks rather than cools. The 4 September employment report confirms the July −23,000 print rather than revising it away, the 11 September CPI comes in soft, and the Committee's three hawkish dissenters lose the argument entirely. The Fed cuts at least once and does not take it back.
Tripwire: August payrolls below −50,000 on 4 September, or unemployment above 4.4 percent. What falsifies it: any positive payroll print with core CPI at or above 0.3 percent month-on-month.
B — Talk Without Action · 25%
The Chair's rhetoric stays hawkish and the Committee does not move. The constraint that has bound several previous chairs binds this one: three dissents is not a majority, the political cost of tightening into a supply shock is real, and each meeting passed makes the next one harder to justify. The target range is 3.50–3.75 percent in December, exactly where it is today.
Tripwire: a September hold in which the SEP median dot for end-2026 stays at 3.75 percent. What falsifies it: a September hike, which removes this branch entirely.
C — One and Done · 50% — base case
The Committee raises once, most likely in September with the cover of a Summary of Economic Projections, and then stops. The hike is framed as insurance against unanchoring rather than the start of a cycle; the December SEP shows a flat path. This is the base case because it is what a committee does when the Chair says conditions are not restrictive, three members already want to move, and the inflation gauge the Chair himself cites is running at 3.7 percent with a six-month rate of 4.1 percent — but when the labour market is contracting and the Treasury is publicly opposed.
Tripwire: a 25bp increase at any 2026 meeting followed by "the Committee will assess" language rather than forward guidance toward further increases. What falsifies it: two increases, or none.
D — The Cycle Restarts · 20%
Fifty basis points or more of net tightening. The simulation models the Committee in 25bp steps, which is the modal increment and the one every current market contract is quoted in; a single 50bp move would resolve this bucket too and is not separately modelled. In practice this means two increases. This is Deutsche Bank's published call — 50 basis points this year, September and December — and Bank of America's direction of travel. It requires the six-month PCE run rate at 4.1 percent to be validated by the August and September prints, and it requires the Gulf to keep supplying an energy impulse rather than the EIA's forecast reversal arriving.
Tripwire: a September hike accompanied by an SEP median showing a further increase by year end; or core PCE above 3.5 percent in the 6 October release. What falsifies it: any single meeting at which the Committee describes policy as "sufficiently restrictive."
Simulation Results
A real Monte Carlo was run. Code, full console output and the machine-readable result set ship with this edition (mc.py, mc-run-output.txt, mc_out.json).
Design. 50,000 paths, seed 20260831, numpy 2.2.6. Four correlated latent drivers — inflation persistence, oil, labour strength, financial-conditions ease — drawn as a multivariate normal through a Cholesky factorisation, decomposed each meeting into a persistent component and a transitory one. A path-level random reaction-function term, correlated 0.35 with the inflation driver, represents the Committee's split: treating the reaction function as deterministic is the error this replaces. Hawkishness is a weighted sum, standardised, compared each meeting to a hiking threshold and a cutting threshold. The hiking threshold is not hand-set; it is solved by bisection to reproduce the market-implied September probability exactly. Path dependence is carried by a state variable that raises the bar after a move (gradualism, financial-conditions feedback) and lowers it after a hold, plus a penalty on October for carrying no SEP.
Baseline output, anchored at 60.4 percent for September:
| Bucket | Probability | Sampling error |
|---|---|---|
| A ≤3.50% | 5.0% | ±0.19pp |
| B =3.75% | 23.0% | ±0.37pp |
| C =4.00% | 51.9% | ±0.44pp |
| D ≥4.25% | 20.1% | ±0.35pp |
| P(≥1 hike by December) | 75.9% | ±0.37pp |
Per-meeting hike probability: September 60.4 percent (by construction), October 20.0, December 17.7 — a monotone decay, which is the model saying that a committee that declines to move at a meeting the market priced above a coin flip has told you something the incoming data did not.
The intervals above are sampling error and are demoted. They are not the precision of the forecast. The honest statements of uncertainty are the two envelopes below.
Structural envelope, anchor genuinely held fixed (16 specifications): P(≥1 hike) [71.4%, 81.6%]; P(two or more) [7.8%, 29.2%]. Every specification in this envelope re-calibrates to the same September anchor. Threshold shifts of ±20 basis points are deliberately excluded: moving the threshold moves the implied September probability to 68.0 percent and 52.6 percent respectively, which is moving the anchor, not holding it. Including them would widen the band to [68.1%, 82.7%] and would be comparing the anchor against itself. What the 16 specifications do span is the hold-decay term switched off and doubled, the October SEP penalty off and doubled, gradualism halved and doubled, financial-conditions feedback halved and doubled, the oil–inflation correlation at 0.00 / 0.25 / 0.45 / 0.65 with the calibration re-solved inside each loop, a Student-t (ν=4) copula, an independent-drivers control, and the EIA oil-reversal variant.
Anchor envelope (six September anchors the market actually printed this week):
| September anchor | A | B | C | D | P(≥1 hike) |
|---|---|---|---|---|---|
| 35% — pre-speech, 27 Aug | 5.3% | 49.1% | 39.0% | 6.7% | 48.4% |
| 50% — Friday intraday | 5.0% | 33.2% | 48.6% | 13.3% | 65.3% |
| 56% — Friday close | 5.0% | 27.0% | 51.1% | 16.9% | 71.7% |
| 60.4% — Monday 07:28 ET (used) | 5.0% | 23.0% | 51.9% | 20.1% | 75.9% |
| 66.1% — Monday afternoon (reported, not verified by this Desk) | 4.9% | 18.1% | 52.1% | 24.8% | 81.1% |
| 75% — hypothetical | 4.9% | 10.7% | 50.1% | 34.4% | 88.9% |
P(≥1 hike) across anchors: [48.4%, 88.9%] — a span of 40.5 points. Against an anchor-fixed structural envelope of [71.4%, 81.6%] — a span of 10.2 points. The anchor is worth about four times every structural assumption combined. Some of that is by construction, and we say so plainly: the hiking threshold is solved to reproduce the anchor, so of course the anchor matters. What is not by construction is that it matters four times as much as everything we actually chose. Any reader who disagrees with the market's September pricing should read this table rather than our headline number, find their own anchor, and take the corresponding row. That is the intended use.
What we found when we fixed the model
This edition was blocked overnight on a methodology defect, and the fix changed the answer more than the fix's author expected. We publish the sequence because the sequence is the evidence.
An external methodology review found that the hawkishness function was standardised by the closed form √(Σwᵢ²) — which equals the variance of a weighted sum only when the drivers are independent. With a non-identity correlation matrix the correct quantity is wᵀΣw. The review's own assessment was that the defect would prove harmless: because the hiking threshold is solved by bisection, dividing hawkishness by any positive constant and re-solving gives identical decisions, so the marginal probabilities should be unchanged.
They were not. At an identical anchor, correcting the normalisation moved the two-or-more-hikes bucket from 20.2 percent to 13.3 percent and shifted 5.2 points from that bucket into the one-hike bucket.
The reason is that the absorption argument is true of thresholds and false of offsets. The gradualism, financial-feedback, hold-decay and October-penalty terms are added to the barrier in hawkishness units and are not rescaled by the calibration. The empirical standard deviation of hawkishness was 1.8710 against the closed-form 1.4552 — the old normalisation overstated the driver's dispersion by 28.6 percent, which made those fixed carry terms 28.6 percent smaller in genuine sigma units, which let too many paths deliver a second hike.
We verified the mechanism rather than asserting it. Running the old normalisation with the carry constants scaled by exactly that 1.2858 ratio reproduces the corrected result — 48.6 percent and 13.3 percent for the one-hike and two-hike buckets against the corrected run's 48.6 and 13.3 — while the unmodified old code reproduces the old result to the decimal. The diagnostic ships as mc-normalisation-diagnostic.py.
The correction also retired a figure. Before the fix, the model appeared to show that driver correlation added 7.3 percentage points to the tail. That number was an artefact. Measured correctly at the published anchor, with each configuration standardised by its own dispersion and re-calibrated independently, correlation is worth +0.4 percentage points on the tail and +0.9 on the union. The 7.3-point figure never reached a published surface, and it does not appear in this one except here, as a correction.
A calibration that absorbs a scaling error in one place will not absorb it in another, and the difference is exactly the terms you forgot were denominated in the same units.
Market Pricing vs the Desk View
| A ≤3.50% | B =3.75% | C =4.00% | D ≥4.25% | P(≥1 hike) | |
|---|---|---|---|---|---|
| Desk model | 5.0% | 23.0% | 51.9% | 20.1% | 75.9% |
| Desk published | 5% | 25% | 50% | 20% | 70% |
| Market-implied, 9 Dec meeting | ~0% | 11.6% | 38.5% | 49.9% | ~88.4% |
The market-implied column is the CME-derived December 9 meeting distribution read on 31 August 2026 from a public aggregator (3.50–3.75% at 11.6 percent, 3.75–4.00% at 38.5, 4.00–4.25% at 38.9, 4.25–4.50% at 11.0). Confidence: medium, and this is the weakest number on the page. It is an aggregator's derived table, not a quote from an exchange; on re-checking, the page returns HTTP 403 to automated retrieval, so it cannot be re-verified after the fact. Treat "~88 percent" as an indicative CME-derived aggregator read, not a market print. Every conclusion in this report that depends on it is stated as a disagreement of direction, not of decimals. Kalshi's "next Fed hike before 2027" contract read 66 percent on 29 August; that is a different contract on a longer horizon and the two are not reconciled. Both are reported. Neither is a model input.
The highest-conviction disagreement is the tail, not the base case. The market puts 49.9 percent on two or more increases by December. The Desk puts 20. To get to the market's number you need the Committee to hike in September and then hike again within twelve weeks, with an October meeting that carries no SEP and a labour market that shed jobs in July. Our model, told nothing except the September probability, generates 20.1 percent for that branch, and no structural variant we ran pushed it past 29.2 percent. If the Desk is wrong anywhere on this page, this is where the market thinks so.
What consensus is missing. The gap between the two most-cited inflation gauges is doing quiet work. Headline PCE is 3.7 percent and the Chair cited it by name. Core CPI is 2.47 percent and the supply-shock camp cites that. But core PCE is 3.34 percent — 134 basis points above target, and it excludes energy. The "it is all petroleum" argument is defensible against the CPI and much weaker against the gauge the Committee actually targets. That is the single most under-discussed number in this debate, and it is the main reason this Desk did not shade harder toward the doves.
Universal-Owner Portfolio Heatmap
Direction of the reprice if the December outcome resolves in each bucket. Magnitude bands are the Desk's qualitative judgment, not modelled outputs.
| Asset class | A ≤3.50% | B unchanged | C one hike | D two or more |
|---|---|---|---|---|
| Long-duration sovereigns | ▲▲ strong | ▲ mild | ▼ mild | ▼▼ strong |
| Front-end rates (2y) | ▲▲▲ | ▲▲ | ▼▼ | ▼▼▼ |
| Curve shape (2s30s) | steepen | mild steepen | flatten | bear flatten, sharp |
| Global equities | ▼ (growth scare) | ▲ mild | ▼ mild | ▼▼ |
| Investment-grade credit | ▲ | ▲ | ~ flat | ▼ spread widening |
| Private credit (floating) | ▼ coupon | ~ | ▲ coupon, ▼ coverage | ▲▲ coupon, ▼▼ coverage |
| Private equity marks | ▲ | ~ | ▼ | ▼▼ discount-rate hit |
| Real estate / infrastructure | ▲▲ | ▲ | ▼ | ▼▼ |
| DB pension funded ratios | ▼ (liabilities up) | ~ | ▲ (liabilities down) | ▲▲ |
| Insurance reinvestment yield | ▼ | ~ | ▲ | ▲▲ |
| USD | ▼▼ | ~ | ▲ | ▲▲ |
| EM local-currency debt | ▲▲ | ▲ | ▼ | ▼▼ |
| Gold / reserve assets | ▲ | ▲ mild | ▼ mild | ▼ |
| Commodities / energy | ▼ | ~ | ~ | ▼ demand drag |
The direction that gets misread. For a defined-benefit plan, D is good for the funded ratio, not bad. Higher discount rates cut the present value of liabilities faster than they cut the value of a diversified asset pool, which is why Ontario's plans and their peers have been reporting record solvency into a rate environment their own members find alarming. Lower yields raise liabilities. The sign is counter-intuitive and it is wrong in print more often than it is right.
Second- and Third-Order Effects
The floating-rate squeeze cuts both ways in the same portfolio. A universal owner holding private credit at the top of the house and private equity underneath it receives a higher coupon in bucket D and finances a more levered portfolio company with it. The coupon is booked immediately; the coverage deterioration shows up two to four quarters later in a mark that no one has to publish quarterly. This is the single most under-modelled correlation in large allocator books, and D is the scenario that surfaces it.
A hiking Fed in an easing world re-opens the FX transmission. If the Committee raises while other major central banks hold, the dollar strengthens against a broad basket already at 118.75 on the trade-weighted index. For sovereign funds of energy exporters this partially offsets a Gulf-risk windfall; for EM importers it compounds an oil shock with a currency shock, which is the classic mechanism by which a US policy decision becomes a Global South fiscal event.
The credibility trap is a real transmission channel, not a commentator's flourish. Bank of America's argument — that Warsh now has to deliver or lose the credibility he gained — is a statement about the cost of not acting rising after the speech. If that is right, the model's monotone decay across meetings is too steep, because it treats a September hold as evidence of dovishness when it may be evidence of a delay. That is the sharpest technical objection to our own architecture, and we flag it rather than bury it.
Institutional independence becomes an investable variable. A Treasury Secretary publicly arguing against a rate increase while a hundred-day Chair weighs one is a governance datum, not only a political one. Reserve managers price central-bank independence; they have been doing so with increasing explicitness since 2025. A visible executive–Fed disagreement resolved in the executive's favour would be read in reserve-management committees far outside the United States, and would show up in allocation decisions long before it showed up in a policy statement.
The Watch Dashboard
| # | Indicator | Current | Source | Threshold that changes the model |
|---|---|---|---|---|
| 1 | August employment report | released 4 Sep | BLS | payrolls < −50,000 → A live; > +100,000 → D live |
| 2 | August CPI | released 11 Sep | BLS | core ≥ 0.3% m/m → C/D; ≤ 0.1% → B |
| 3 | September FOMC + SEP | 15–16 Sep | Federal Reserve | the single highest-information event in the window |
| 4 | Dissent count at the September meeting | 3 hawkish in July | FOMC statement | 4+ hawkish dissents on a hold → D re-weights up |
| 5 | End-2026 SEP median dot | — | Sep SEP | 4.00% → C confirmed; 4.25% → D |
| 6 | Headline PCE 6-month annualised | 4.1% | Warsh, 28 Aug | falling below 3.0% → B/A |
| 7 | Core PCE y/y | 3.34% | FRED PCEPILFE | below 3.0% removes the Desk's main hawkish leg |
| 8 | Dallas Fed trimmed-mean PCE | 2.3% | Dallas Fed | above 2.6% → the supply-shock defence collapses |
| 9 | Brent | $90.49 (31 Aug) | ICE / EIA STEO | sustained above $95 → D; below $80 by October → B |
| 10 | EIA STEO Brent path | $85 Sep, $76 Dec | EIA STEO Aug | a September STEO revision upward is a hawkish signal |
| 11 | 2-year Treasury | 4.34% (28 Aug) | FRED DGS2 | above 4.60% → market at two hikes; below 4.10% → hold |
| 12 | 2s30s slope | 88bp (28 Aug) | FRED DGS2/DGS30 | further bear flattening confirms the market's tail |
| 13 | 5y5y forward breakeven | 2.32% | FRED T5YIFR | above 2.60% → unanchoring, D re-weights up sharply |
| 14 | Broad dollar index | 118.75 (28 Aug) | FRED DTWEXBGS | above 122 → EM importer stress channel opens |
| 15 | Executive–Fed friction | Bessent on record 31 Aug | public statements | a named attempt to constrain the September vote |
Red-Team — How This Could Be Wrong
1. The anchor is a momentum reading and we built on it anyway. Our own headline finding is that the market's September number drives everything, and we then calibrated to a number that moved 25 points in three sessions. If the anchor mean-reverts to the mid-40s on a soft 4 September payroll print, our 70 percent will look like extrapolation dressed as analysis. The defence is that we published the whole anchor curve rather than a point, so a reader who disagrees can take a different row. The defence is not that we picked the right row.
2. The monotone decay across meetings may be backwards. The model treats a September hold as evidence the Committee will not hike later. Bank of America's credibility argument says the opposite: a Chair who signals and then does not act is under more pressure at the next meeting, not less. If that is right, October and December are underweighted, the base case is too fat, and bucket D is too thin — which is precisely where the market disagrees with us most.
3. Four dovish house views is not four independent observations. Citi, JPMorgan Asset Management, Goldman and Miller Tabak are drawing on largely the same data with largely the same framework in the same forty-eight hours. Treating them as four sources understates their correlation. The Goldman item is also secondary-sourced and carries lower confidence than the others.
4. The scenarios are defined on the target range and nothing else. A Committee that holds the range while altering the pace of balance-sheet runoff, or changing the administered rates within the corridor, resolves as bucket B while having tightened materially. The question is gradeable, which is the point, but gradeable is not the same as complete.
5. We cannot verify the intraday number we did not use. A 66.1 percent September reading was reported for Monday afternoon. We did not use it — not because it is unsourced, but because its 15:38 ET timestamp postdates the specification of this model, and calibrating to a reading that had not printed when the run began is hindsight, not forecasting. We anchored at the verified 60.4 percent morning figure instead. If 66.1 is the right anchor, the model returns 81.1 percent and our published 70 is roughly nine points light rather than two.
Methodology box
The Probability Desk owns the number. Scenario weights are produced by combining a stated institutional prior (the 9–3 July vote and its three hawkish dissents), named and dated expert priors from both directions, and a 50,000-path Monte Carlo whose hiking threshold is calibrated by bisection to the market-implied September probability rather than hand-set. The published view then departs from the model by a stated amount, for stated reasons, with the deltas shown rather than reconciled away. Every figure sourced to FRED, the EIA, BLS or the Federal Reserve was pulled live for this edition; every attributed view carries an institution, a person where named, a date and a URL in the Source Ledger. No simulation is claimed that was not run; the console output ships with the edition. Confidence intervals in the simulation section are sampling error and are explicitly demoted in favour of the specification and anchor envelopes. Where a figure could not be verified from a dated source, it is marked unverified and is not used.
Editorial scenario analysis only. Not investment, actuarial, or geopolitical advice.
Source Ledger
| # | Source | URL | Date | Data point used | Conf. |
|---|---|---|---|---|---|
| 1 | Federal Reserve — Chair Warsh, Jackson Hole keynote | https://www.federalreserve.gov/newsevents/speech/warsh20260828a.htm | 28 Aug 2026 | "my 100th day as Chairman" | H |
| 2 | Federal Reserve — same speech | (same) | 28 Aug 2026 | "…they do not tell me that underlying trends have meaningfully improved." | H |
| 3 | Federal Reserve — same speech | (same) | 28 Aug 2026 | "hard pressed to describe broad financial conditions as restrictive" | H |
| 4 | Federal Reserve — same speech | (same) | 28 Aug 2026 | "Otherwise, we have work to do." | H |
| 5 | Federal Reserve — same speech | (same) | 28 Aug 2026 | PCE 12-month 3.7%, six-month 4.1% | H |
| 6 | Federal Reserve — same speech | (same) | 28 Aug 2026 | "The jobless rate, at 4.1 percent, remains low by historical standards" | H |
| 7 | Federal Reserve — FOMC statement | https://www.federalreserve.gov/newsevents/pressreleases/monetary20260729a.htm | 29 Jul 2026 | range maintained at 3½–3¾%; approved 9–3 | H |
| 8 | Federal Reserve — same statement | (same) | 29 Jul 2026 | Hammack, Kashkari, Logan dissent, preferring +25bp | H |
| 9 | Federal Reserve — FOMC calendar | https://www.federalreserve.gov/monetarypolicy/fomccalendars.htm | accessed 31 Aug 2026 | Sep 15–16, Oct 27–28, Dec 8–9; * = SEP | H |
| 10 | Federal Reserve — Warsh oath of office | https://www.federalreserve.gov/newsevents/pressreleases/other20260522a.htm | 22 May 2026 | sworn in as Chairman | M |
| 11 | CNBC | https://www.cnbc.com/2026/08/28/-september-fed-decision-now-a-coin-flip-as-rate-hike-odds-increase.html | 28 Aug 2026 11:22 ET | futures ~56% for September; Polymarket 49% | H |
| 12 | CNBC | https://www.cnbc.com/2026/08/31/jackson-hole-fed-chair-kevin-warsh-hawkish-rate-hikes-analysts.html | 31 Aug 2026 07:28 ET | 60.4% September, up from ~56% Friday — the model anchor | H |
| 13 | CNBC — same | (same) | 31 Aug 2026 | Deutsche Bank: 50bp of hikes this year, September and December | H |
| 14 | CNBC — same | (same) | 31 Aug 2026 | Nomura: "hawkish remarks… policy may need to react" | H |
| 15 | CNBC — same | (same) | 31 Aug 2026 | Miller Tabak (Maley): "no empirical basis for the rate hike" | H |
| 16 | CNBC | https://www.cnbc.com/2026/08/31/markets-see-warsh-endorsing-a-rate-hike-in-september-not-everyone-is-convinced.html | 31 Aug 2026 | Citigroup (Hollenhorst): "There will not be a consensus to hike rates in September." | H |
| 17 | CNBC — same | (same) | 31 Aug 2026 | JPMorgan Asset Management (Kelly): markets "may have been premature" | H |
| 18 | CNBC — same | (same) | 31 Aug 2026 | Bank of America (Bhave): "the onus is now on Warsh to deliver" | H |
| 19 | CNBC — same | (same) | 31 Aug 2026 | Treasury Secretary Bessent: "you don't raise into a supply shock" | H |
| 20 | CNBC — same | (same) | 31 Aug 2026 | July PCE headline 3.7%, core 3.3%; Dallas Fed measure 2.3% | H |
| 21 | Kalshi News | https://news.kalshi.com/p/fed-rate-hike-odds-september-2026-jackson-hole-speech | 29 Aug 2026 | September 47%; pre-speech 30%; "next hike before 2027" 66% | H |
| 22 | Investing.com Fed Rate Monitor (CME-derived) | https://www.investing.com/central-banks/fed-rate-monitor | accessed 31 Aug 2026 | Dec-9 distribution 11.6 / 38.5 / 38.9 / 11.0 | M |
| 23 | BLS — Employment Situation, July 2026 | https://www.bls.gov/news.release/empsit.nr0.htm | 7 Aug 2026 | payrolls −23,000; unemployment 4.1% | H |
| 24 | BLS — same | (same) | 7 Aug 2026 | May revised +129k → +63k; June +57k → +20k | H |
| 25 | BLS — same | (same) | 7 Aug 2026 | August Employment Situation scheduled 4 Sep 2026 | H |
| 26 | BLS — CPI, July 2026 | https://www.bls.gov/news.release/cpi.nr0.htm | 12 Aug 2026 | CPI +3.4% y/y; core +2.5% y/y; August CPI due 11 Sep 2026 | H |
| 27 | BEA — release schedule | https://www.bea.gov/news/schedule | accessed 31 Aug 2026 | August Personal Income & Outlays 6 Oct — after the September FOMC | H |
| 28 | FRED DFEDTARU / DFEDTARL |
https://fred.stlouisfed.org/series/DFEDTARU | 31 Aug 2026 | target range 3.50–3.75% | H |
| 29 | FRED DGS2 |
https://fred.stlouisfed.org/series/DGS2 | 28 Aug 2026 | 4.34%, from 4.20% on 27 Aug | H |
| 30 | FRED DGS10 |
https://fred.stlouisfed.org/series/DGS10 | 28 Aug 2026 | 4.73%, from 4.67% | H |
| 31 | FRED DGS30 |
https://fred.stlouisfed.org/series/DGS30 | 28 Aug 2026 | 5.22%, from 5.19% | H |
| 32 | FRED PCEPI |
https://fred.stlouisfed.org/series/PCEPI | Jul 2026 | headline PCE +3.70% y/y — matches the Chair's citation | H |
| 33 | FRED PCEPILFE |
https://fred.stlouisfed.org/series/PCEPILFE | Jul 2026 | core PCE +3.34% y/y | H |
| 34 | FRED CPILFESL |
https://fred.stlouisfed.org/series/CPILFESL | Jul 2026 | core CPI +2.47% y/y | H |
| 35 | FRED CPIENGSL |
https://fred.stlouisfed.org/series/CPIENGSL | Jul 2026 | energy CPI +14.45% y/y | H |
| 36 | FRED CUSR0000SETB01 |
https://fred.stlouisfed.org/series/CUSR0000SETB01 | Jul 2026 | gasoline CPI +24.64% y/y | H |
| 37 | FRED PAYEMS |
https://fred.stlouisfed.org/series/PAYEMS | Jul 2026 | 158,858k vs 158,881k June = −23,000 | H |
| 38 | FRED T5YIFR |
https://fred.stlouisfed.org/series/T5YIFR | 28 Aug 2026 | 5y5y forward breakeven 2.32% | H |
| 39 | FRED DTWEXBGS |
https://fred.stlouisfed.org/series/DTWEXBGS | 28 Aug 2026 | broad dollar index 118.75 | H |
| 40 | FRED CORESTICKM159SFRBATL |
https://fred.stlouisfed.org/series/CORESTICKM159SFRBATL | Jul 2026 | Atlanta Fed sticky-price core CPI 2.72% | H |
| 41 | EIA Short-Term Energy Outlook, series BREPUUS |
https://www.eia.gov/outlooks/steo/ | Aug 2026 | Brent $87 Aug → $85 Sep → $80 Oct → $78 Nov → $76 Dec; 2027 avg ~$69.50 | H |
| 42 | CNBC | https://www.cnbc.com/2026/08/31/oil-prices-hormuz-iran-larak-island-centcom.html | 30–31 Aug 2026 | Brent Sep +2.7% to $90.49; WTI +2.8% to $85.76 | H |
| 43 | CNBC — same (CENTCOM, Capt. Tim Hawkins) | (same) | 30 Aug 2026 | US strike on two Iranian launchers, Larak Island | H |
| 44 | CNBC — same (Iranian media claim) | (same) | 30 Aug 2026 | claimed retaliation on US bases in Jordan — unverified | L |
| 45 | Investinglive / Goldman Sachs (Hatzius) | https://investinglive.com/central-banks/goldman-sachs-still-sees-fed-on-hold-despite-warsh-s-hawkish-jackson-hole-tone/ | ~28–29 Aug 2026 | Goldman still sees a September hold — secondary sourcing | M |
Not verified, and therefore not used as evidence: a Morgan Stanley "on hold" call (no primary article opened); a JPMorgan Global Research December-hike note (aggregators conflate it with the July press conference); a Pantheon Macroeconomics note (source returned HTTP 403); the Friday 28 August Brent settlement level (snippet sources carried an internal date inconsistency); the Iranian claim of retaliatory strikes in Jordan; and the 66.1 percent Monday-afternoon FedWatch reading — which is not unverifiable (it appears in a CNBC article this ledger cites four other times at high confidence) but is untimely: the article carries a 15:38 ET timestamp and this run was built between 13:12 and 15:00 ET, so calibrating to it would mean anchoring today's model on a print that had not yet happened when the model was specified.
The Probability Desk · Universal Asset Owners Editorial scenario analysis only. Not investment, actuarial, or geopolitical advice.
Continue the briefing. Read the daily brief · watch the daily video briefing · listen to The Universal Owner · view the chart of the day.
Produced and edited by the UAO editorial desk. Not investment advice.