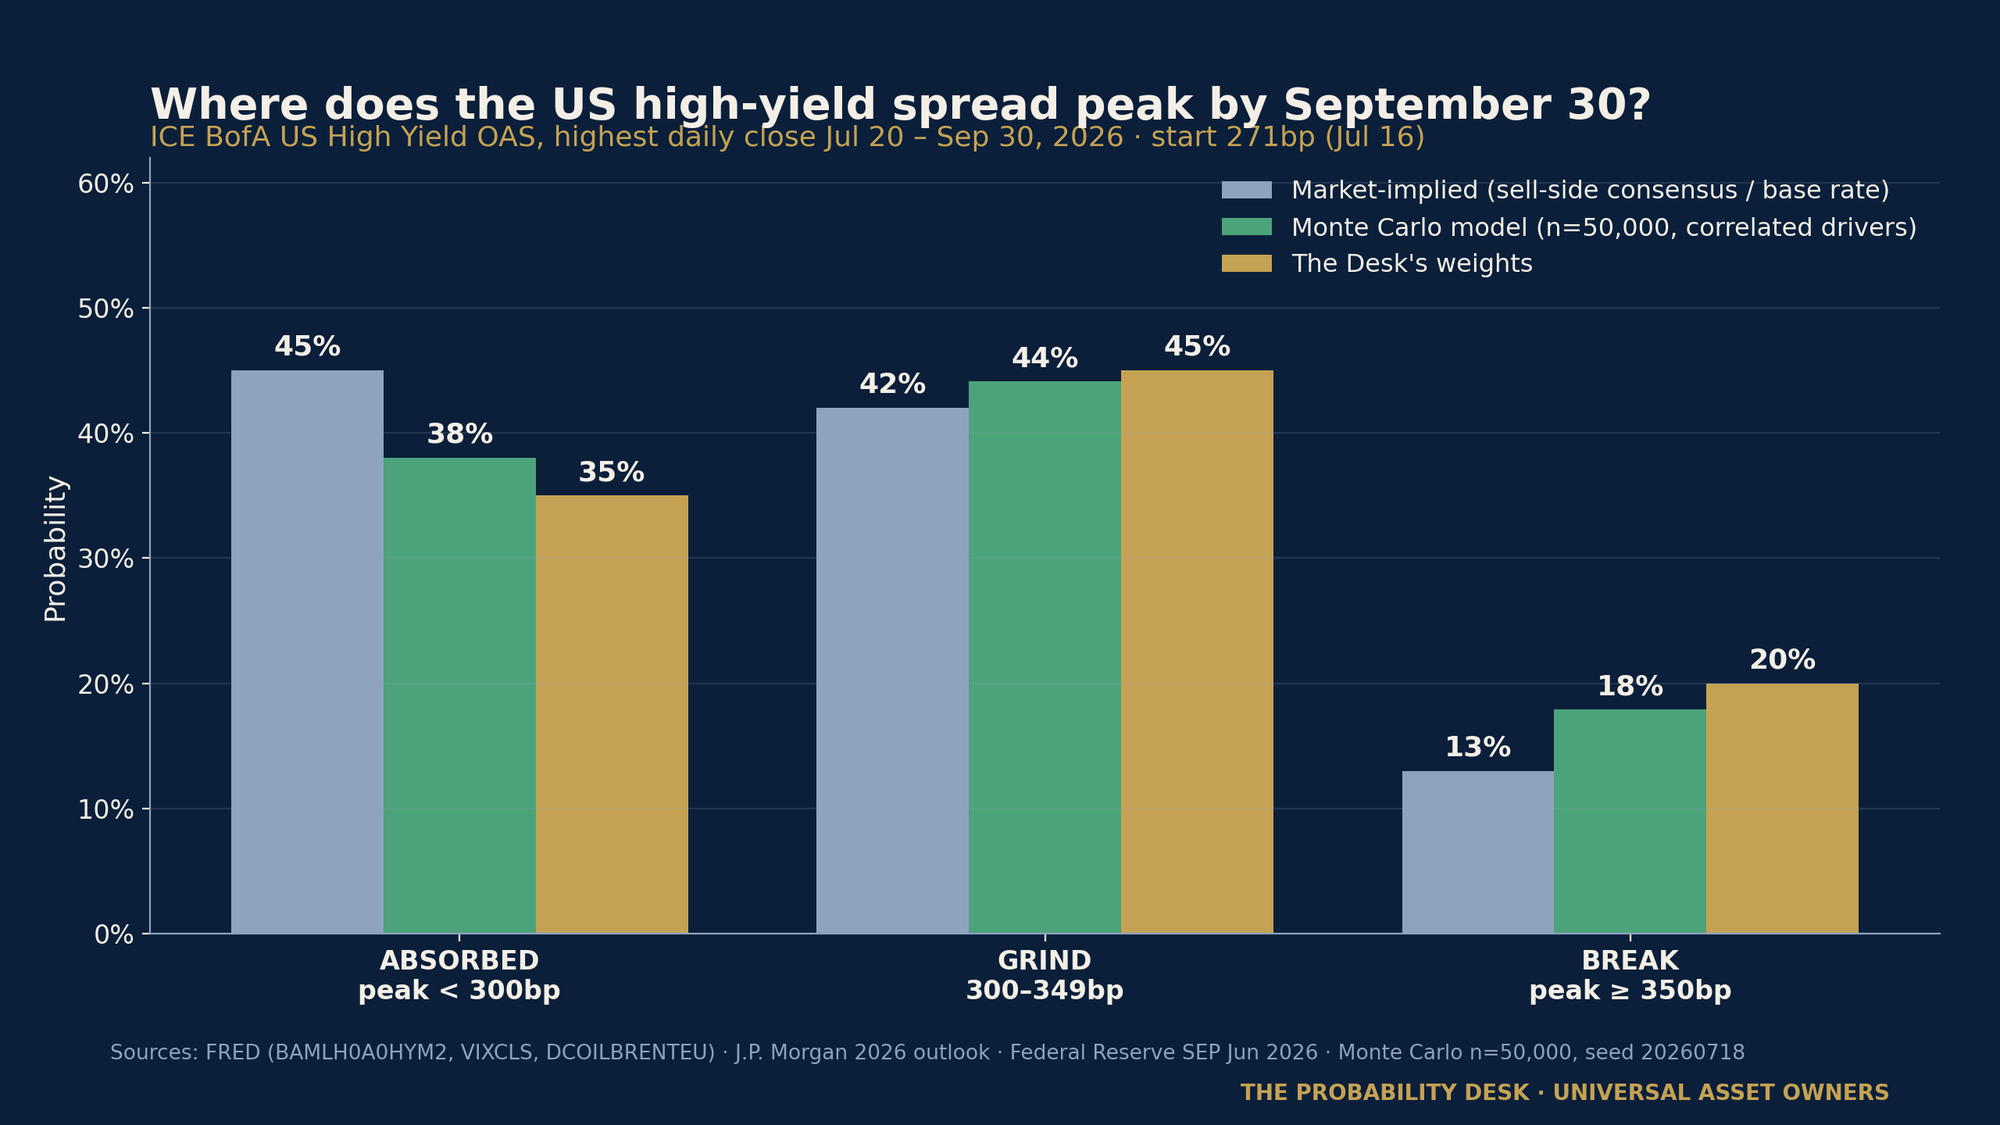
The war premium is back in oil, equities are selling their AI winners, and the one market that has refused to flinch all year — US high-yield credit — is still priced at 271 basis points over Treasuries. The Desk puts a 20% probability on that composure breaking before the end of September — half again what consensus prices.
The Trigger
Two stresses arrived in the same week and neither has reached credit yet. Brent closed Friday at $88.10, up 4.6% on the day, after a sixth consecutive night of strikes and tanker-tracking data showing Strait of Hormuz transits running roughly 60% below early-July levels. At the same time, equities sold off their AI and semiconductor leadership — the S&P 500 finished at 7,457.69, down 1.01%, with the VIX up 12% to 18.77. Yet the ICE BofA US High Yield option-adjusted spread closed Thursday at 271bp — three basis points tighter than where it started the month's first war scare. Two-year Treasury yields, meanwhile, touched 4.26% on July 13, a 16-month high, as the rates market briefly entertained hike risk. Credit is the last calm room in a noisy house. The question is whether that calm is information or inertia.
The Forecast Question
Where does the ICE BofA US High Yield OAS peak — its highest daily close — between July 20 and September 30, 2026?
Three mutually exclusive outcomes, graded on FRED daily closes (series BAMLH0A0HYM2) on October 1:
A. ABSORBED — the spread never closes at or above 300bp. The shock stays in oil and equities.
B. GRIND — at least one close between 300 and 349bp. Credit reprices, but in an orderly, carry-cushioned way.
C. BREAK — at least one close at or above 350bp. The war premium and the AI de-rating reach the financing markets.
Starting point: 271bp (July 16 close). A BREAK requires +79bp inside 52 trading days.
Prior / Base Rate
Over the past three years of daily FRED data — a period that includes the 2024 growth scare, the 2025 repricings and the February–March 2026 war shock — an episode in which the high-yield spread rose at least 79bp within 52 trading days occurred in roughly 10% of all overlapping windows, and in 14% of windows that began with spreads below 300bp, as today's does. The February–March 2026 analogue is instructive: the Iran war's opening phase added roughly 50bp to high-yield spreads over two months — a repricing, not a rupture — and never produced a 350 close. The uninformed prior for outcome C is therefore about one-in-seven. Everything else is an argument about why this time sits above or below that base rate.
The Evidence-Update Table
| Evidence | Reading | Pushes C |
|---|---|---|
| War premium returned: Brent +4.6% Friday to $88.10; Hormuz transits ~60% below early-July run-rate | Supply shock persisting, not fading | Up |
| Equity leadership breaking: AI/semis selloff, VIX 18.77 (+12% Friday) from a 15–16 base | The single strongest historical driver of HY spreads — our estimated daily correlation between VIX changes and spread changes is 0.55 | Up |
| Two-year yield at 4.26% (July 13), a 16-month high; funding conditions tightening | Refinancing math worsens for levered issuers | Up |
| June CPI fell 0.4% m/m; headline 3.5% y/y (from 4.2%), core 2.6% with a flat monthly print | Disinflation resuming; hike tail shrinking; Fed optionality preserved | Down |
| Fed on hold at 3.50–3.75%; June SEP median still shows one cut by year-end (~3.4%) | A central bank with room to ease is a spread-capping device | Down |
| Oil is rising, not crashing — energy is ~14% of the high-yield index and its historical widening trigger is sub-$60 oil, not $88 | The energy cohort's cash flows improve in this shock | Down |
| Direct oil→credit transmission historically weak: 3-year daily correlation between Brent moves and spread moves is approximately zero (−0.08) | The oil channel runs through equity vol, not through credit directly | Down |
| Carry demand: consensus year-end targets near 300bp (J.P. Morgan), yield-buyer inflows persistent all year | Every widening episode since 2024 has been bought | Down |
The Scenarios
A. ABSORBED — peak below 300bp. Desk weight: 35%
De-escalation arrives inside four to six weeks — a ceasefire track, escorted convoys normalizing transits, the war premium bleeding out of Brent as it did in March. Equity vol stays capped below 22, the July 28–29 FOMC keeps a cut alive, and credit finishes the quarter having never priced the episode at all. This is the sell-side's modal case, and it has been the winning trade all year.
B. GRIND — at least one close in the 300–349bp band. Desk weight: 45%
The February–March playbook repeats from a tighter starting point: the conflict simmers, oil holds $80–95, equity vol churns in the high teens to low 20s, and high-yield drifts 30–60bp wider as September's heavy post-Labor-Day issuance calendar meets a choppier tape. A 300+ close needs only a +29bp move — about four average daily standard deviations of cumulative drift — and our model's simmer-state attractor sits at 288bp. Orderly, buyable, and largely carry-offset.
C. BREAK — at least one close at or above 350bp. Desk weight: 20%
Escalation compounds: sustained supply loss above 2mb/d, Brent through $100, a VIX spike into the high 20s, and — critically — the AI de-rating metastasizing from equity multiples into credit availability for the datacenter-adjacent borrowers who have dominated 2026's high-yield and private-credit issuance. In this state the two shocks stop being separate stories and become one story about financing conditions. Sub-marker: the model puts 6% on a 400bp close — the level where primary markets effectively shut.
The Monte Carlo
Fifty thousand paths, seed 20260718, 52 trading days. Three correlated daily drivers — an oil factor, an equity-vol factor and a credit-idiosyncratic factor — drawn from a multivariate normal whose correlation matrix is estimated from three years of FRED daily data (Brent log-changes, VIX changes, spread changes), not assumed. On top of the diffusion sits a weekly regime chain for the conflict — de-escalation, simmer, escalation — that shifts the spread's attractor (255 / 288 / 430bp), its volatility, and its jump intensity. The simmer attractor is calibrated to the February–March episode; regime transition probabilities are Desk judgment, disclosed and stress-tested below.
MODEL OUTPUT (n = 50,000; Monte-Carlo standard error ±0.2pp on each figure)
ABSORBED 38.0% · GRIND 44.1% · BREAK 17.9% · (≥400bp: 6.3%)
Terminal September 30 spread: median 276bp; 10th percentile 241bp; 90th percentile 335bp.
RECONCILIATION — model vs. Desk vs. market
| Model | Desk | Market | Desk−Model | Desk−Market | |
| A Absorbed | 38.0% | 35% | 45% | −3.0pp | −10pp |
| B Grind | 44.1% | 45% | 42% | +0.9pp | +3pp |
| C Break | 17.9% | 20% | 13% | +2.1pp | +7pp |
"Market" = the three-year conditional base rate (13–14%) which is also, in effect, what sell-side year-end targets near 300bp imply for a 350 touch. The Desk shades the model's 17.9% up to 20% — the model's three-year calibration window contains no true credit rupture, and tonight there are two live stress channels, not one. Threshold sensitivity: P(peak ≥340) 22.4%, P(≥350) 17.9%, P(≥360) 14.6%. Escalation sensitivity: halving the weekly escalation-entry probability to 4% takes BREAK to 11.7%; raising it to 12% takes it to 24.6%. Scenario weights are the Desk's judgment, reconciled to the model.
Market vs. Desk View
The market's implicit position — visible in year-end spread targets clustered near 300bp and in the all-year pattern of widening episodes being bought within days — is that credit's calm is justified: carry is king, defaults are contained, and geopolitical premia mean-revert. The Desk's disagreement is narrow but specific: with two live stress channels rather than one, and the strongest spread driver (equity vol) now moving, the tail is half again what consensus prices. We are not forecasting a credit event. We are pricing the insurance mispricing: hedges keyed to a 350 touch cost as if it is a one-in-eight event when it is closer to one-in-five.
The Universal-Owner Portfolio Read
For an institution that owns the whole capital structure, the 350 question is not a trading call — it is a rebalancing trigger and a liquidity-planning date. Three practical readings. First, hedge asymmetry: with spreads at 271bp and index carry near cycle lows relative to risk, credit protection is among the cheapest macro hedges on the board for the specific scenario — escalation plus AI de-rating — that would hurt a diversified portfolio everywhere at once. Second, the private-credit shadow: marks in direct lending lag public spreads by a quarter or more; a public BREAK in August–September lands in private valuations at exactly the year-end window when allocators set 2027 pacing. Committees should pre-agree now what a 350+ print means for unfunded commitments. Third, the countercyclical seat: the institutions reading this are the natural buyers of the wide print. The February–March episode cleared because long-horizon capital showed up 50bp wide of the tights. A pre-authorized add-at-375 program converts this forecast from a risk memo into an execution plan.
Second- and Third-Order Effects
If BREAK prints, the sequence matters more than the level. A 350+ close would arrive with the September issuance calendar open — the first casualty is the primary market, where AI-datacenter and LBO paper gets pulled, pushing borrowers toward private credit at precisely the moment its own spreads gap. CLO formation slows, warehouse lines tighten, and the arbitrage that has absorbed loan supply all year thins out. Insurance investors, the marginal bid for investment-grade credit, get their first genuine book-yield opportunity since March — expect rotation demand to cap IG widening even as HY runs. And a credit wobble into the September 15–16 FOMC flips the Fed conversation from "one cut, maybe" to financial-conditions management — which is, paradoxically, how BREAK seeds the recovery trade.
Watch Dashboard
| Signal | Threshold | Why it matters |
|---|---|---|
| HY OAS daily close (FRED) | ≥300bp | Ends outcome A; first grading gate |
| VIX | Sustained >22 | The 0.55-correlation channel opening |
| Brent | >$95 for a week | Simmer→escalation regime marker |
| Hormuz transit counts | Below ~5mb/d | Supply loss >2mb/d = escalation state |
| July 28–29 FOMC statement | Cut guidance retained or dropped | The spread-capping device's battery level |
| September new-issue calendar | Deals pulled or repriced wide | Primary market is where breaks begin |
Red Team — How This Could Be Wrong
The model's history is short. The three-year FRED calibration window contains no 2008 or 2020 — it may understate true crisis jumps (making 20% too low in a real rupture) while overstating persistence in a period when every scare faded (making 20% too high in the modal path). Both errors are live. Oil may simply never transmit. The measured Brent–spread correlation is approximately zero; if the equity-vol channel also closes — one strong AI earnings print could do it — the entire bear case rests on nothing. The regime matrix is judgment. Our 8% weekly escalation-entry probability is a disclosed opinion about a war, and wars embarrass forecasters in both directions. The 300 line flatters outcome B. It sits only 29bp away; a noise-driven touch would score GRIND without any genuine repricing, which is why we grade on the printed close and accept the convention's roughness. And the strongest force in this market is unspent cash. Yield-hungry inflows have bought every dip for eighteen months; consensus is consensus for a reason.
Methodology Box
Question graded October 1, 2026 on FRED series BAMLH0A0HYM2 daily closes, July 20 – September 30. Monte Carlo: n = 50,000 paths, fixed seed 20260718, 52 trading-day horizon, start 271bp (July 16 close). Drivers: oil, equity-vol and credit factors with correlation matrix estimated from three years of FRED daily changes (the maximum history served; a disclosed limitation); mean-reverting spread process (23-day half-life) with regime-dependent attractor (255/288/430bp), volatility (5/8/16bp per day vs. 7.1bp historical), and upward jumps; weekly conflict-regime Markov chain (simmer start; weekly transitions: simmer→de-escalation 24%, →escalation 8%), floor 220bp. Monte-Carlo standard error ±0.2pp; parameter uncertainty dominates and is reported via threshold and escalation sensitivities in the text. Scenario weights are the Desk's judgment, reconciled to the model and to market-implied levels above. The Desk's ledger is graded publicly; this entry joins it.
Source Ledger
FRED — ICE BofA US High Yield Index Option-Adjusted Spread (BAMLH0A0HYM2)
FRED — CBOE Volatility Index (VIXCLS)
FRED — Brent Crude Oil Price (DCOILBRENTEU)
FRED — 2-Year Treasury Constant Maturity Yield (DGS2)
Federal Reserve — FOMC Statement, June 17, 2026
Federal Reserve — Summary of Economic Projections, June 2026
Federal Reserve — FOMC Minutes, June 16–17, 2026
J.P. Morgan Global Research — 2026 Market Outlook (high-yield spread target ~300bp)
Morningstar — Amid Iran War, Credit Spreads Show Early Signs of Widening
Neuberger Berman — Fixed Income Outlook, 2Q 2026
Janus Henderson — High Yield Bonds Outlook 2026
THE PROBABILITY DESK · UNIVERSAL ASSET OWNERS · A probability-weighted forecast, graded in public. Monte Carlo n=50,000, seed 20260718.