The Trigger
Two data releases and one geopolitical reversal have collided inside a two-week window. On 2 July, June payrolls landed at +57,000 — less than half the 115,000 consensus — with unemployment ticking down to 4.2% only because the participation rate fell to 61.5%, its lowest since March 2021. April and May were revised down a combined 74,000. On 14 July, June CPI cooled to 3.5% headline (from 4.2%) and 2.6% core (from 2.9%), the first inflation decline in five months and below every consensus estimate — driven overwhelmingly by energy giving back its war premium after the mid-June ceasefire.
Then the ceasefire broke. Since 8 July, renewed U.S. strikes on Iran, a reinstated naval blockade near the Strait of Hormuz, and tankers hit in transit have pushed Brent back above $85 and rising. The single largest driver of June's disinflation is now reversing in real time — before the Fed's 28–29 July meeting.
The Forecast Question
Where does the federal funds target range sit at year-end 2026, and is the next move up or down? The Committee is on hold at 3.50–3.75%. Its own June dot plot is hawkish — median year-end projection revised up to 3.8%, with 9 of 19 participants pencilling in a hike. The incoming data say the opposite. The tie-breaker is a barrel of oil.
Prior / Base Rate
Since 1994, once the FOMC has paused for two or more consecutive meetings with the policy rate in restrictive territory, the modal 6-month outcome has been "no change," and when it has moved, cuts have outnumbered hikes roughly three-to-one. But that base rate is conditioned on falling or stable energy — the historical analog set thins sharply when a live supply shock is re-accelerating headline inflation into the decision.
The Evidence-Update Table
| Signal | Reading | Pushes toward |
|---|---|---|
| June core CPI | 2.6%, below consensus | Cut |
| June payrolls | +57k, prior months revised down | Cut |
| Participation rate | 61.5%, lowest since 2021 | Ambiguous |
| Brent crude | >$85, blockade reinstated | Hike |
| June SEP dot plot | Median 3.8%; 9/19 see a hike | Hike |
The Scenarios
The Committee stays at 3.50–3.75% through year-end. June's disinflation buys patience; a visibly cooling labor market removes any urgency to hike; but a re-igniting energy shock keeps them from validating a cut. Data-dependent hold, decision deferred into 2027. The dots are treated as insurance, not a plan.
Labor cooling dominates. The Hormuz shock proves contained or brief, core inflation continues its glide toward 2%, and the participation collapse is read as genuine demand softening rather than noise. The Fed delivers one 25bp insurance cut — most likely at the October or December meeting — landing the range at 3.25–3.50%.
The conflict sustains, Brent holds above $90, and energy drags July–August headline CPI back toward 4%+. The 9-of-19 hike camp wins the argument and the Committee moves to 3.75–4.00%. This is not a fringe outcome — it is the FOMC's own median-adjacent projection, which is precisely why it deserves real weight.
The Monte Carlo
We modelled the year-end policy rate as an ordered outcome driven by three calibrated latent forces — an oil/Hormuz inflation impulse (45% probability the shock sustains through Q3), the pace of disinflation, and labor-market slack — filtered through a hawkish-biased Fed reaction function. 50,000 paths, seed 20260716, reproducible.
| Year-end outcome | Simulated probability |
|---|---|
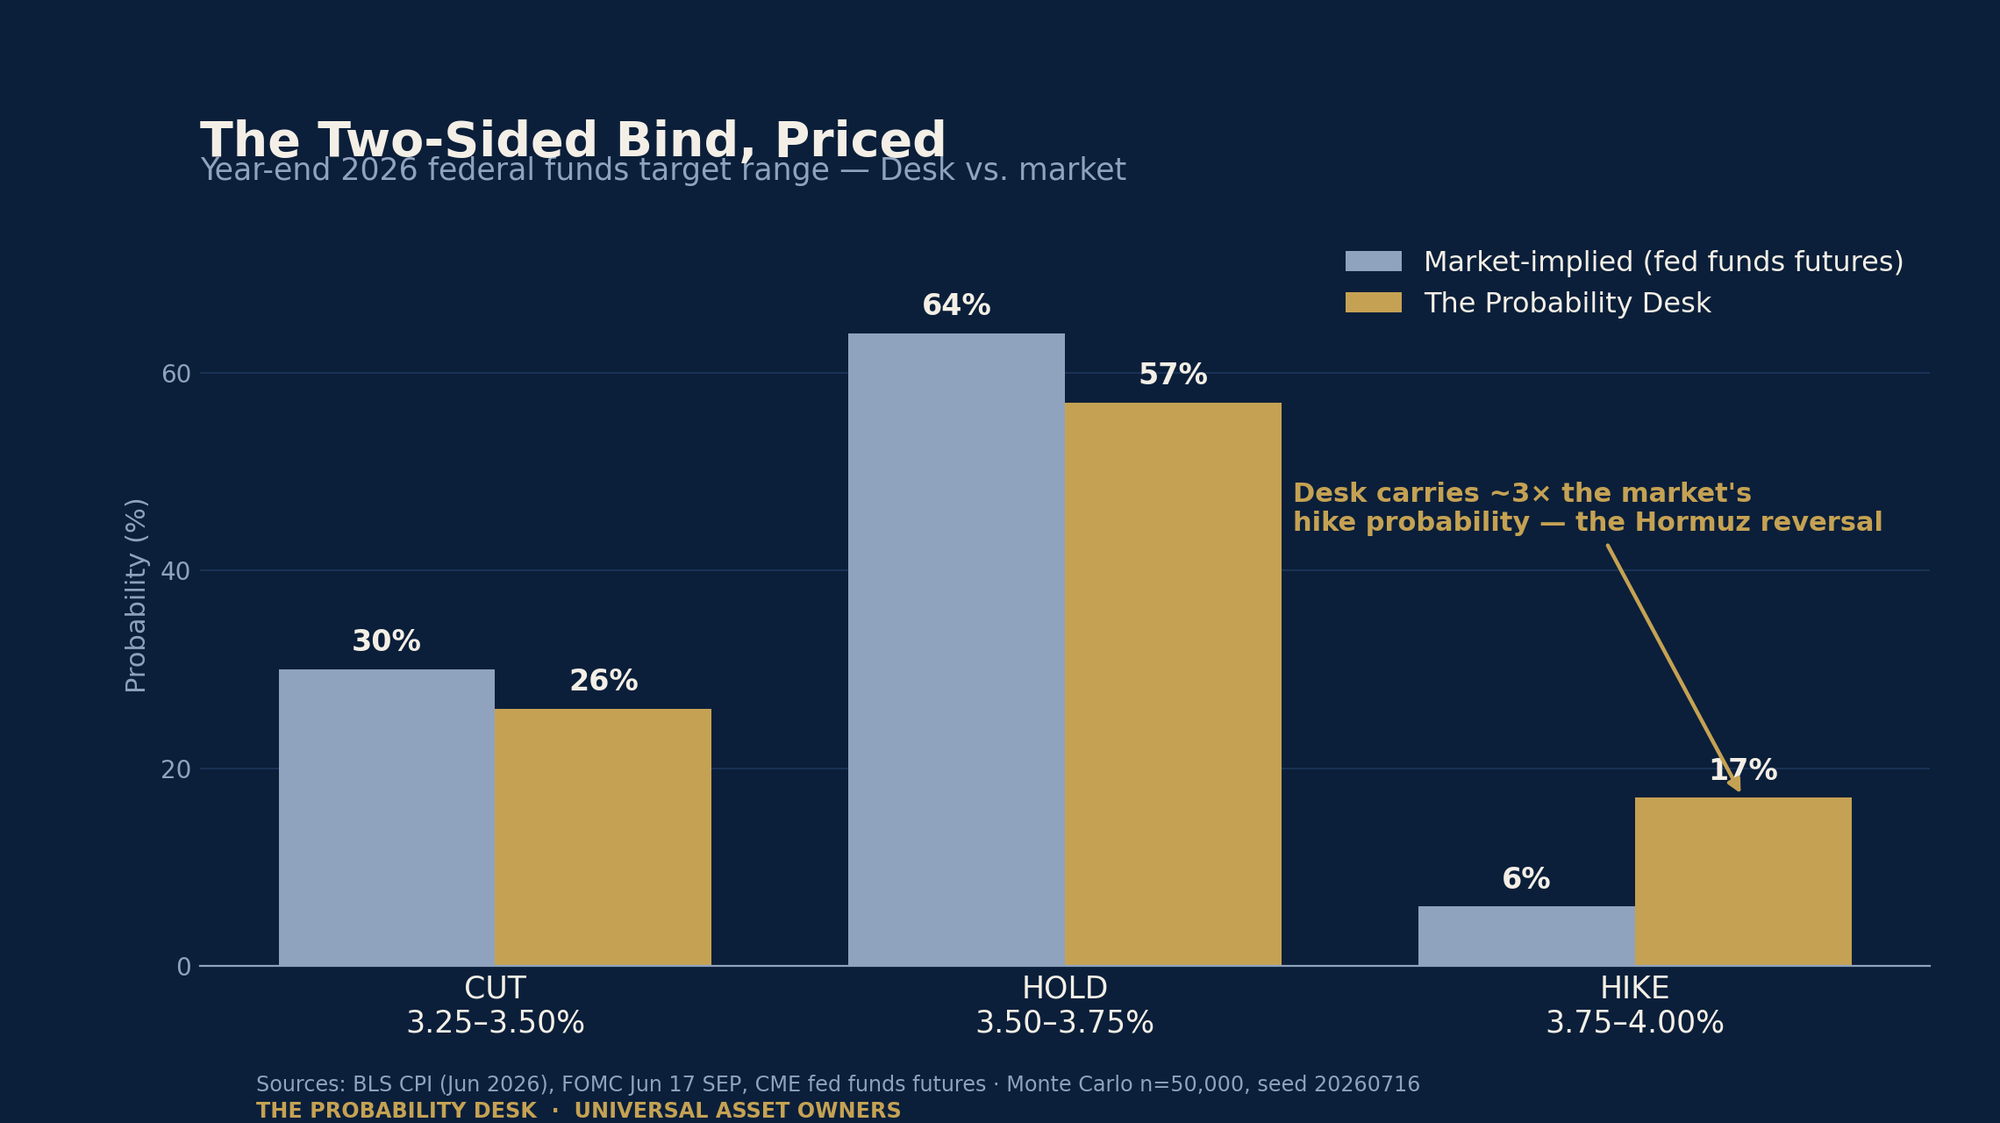
| Hold — 3.50–3.75% | 57% |
| Cut — 3.25–3.50% | 26% |
| Hike — 3.75–4.00% | 17% |
The decisive result is conditional, not marginal: the probability of a hike is 35% if the oil shock sustains, but just 2% if it doesn't. Almost the entire tail risk to duration this year is a Hormuz story wearing an inflation costume. Expected year-end lower bound: 3.48% — statistically, a hold that leans a hair toward a cut.
Market vs. Desk View
Fed funds futures price the year-end distribution as roughly 64% hold / 30% cut / 6% hike. The Desk agrees on the center of gravity but assigns nearly three times the market's hike probability (17% vs. 6%). The gap is entirely the energy reversal: futures are still discounting the mid-June ceasefire that has since collapsed. If you think the market is slow to re-price a live supply shock, the cheap options are on the hawkish tail.
The Universal-Owner Portfolio Read
For an owner of the whole market, the actionable content is not the base case — it is the mispriced tail. A sustained Hormuz shock is simultaneously a duration risk (rates up), an energy-equity and real-asset tailwind, an EM-importer funding stress, and an inflation-linked bond bid. The hedge that pays in the tail is not a rates position alone; it is the correlation between your energy exposure and your long-duration book. Owners who treated June's soft print as the all-clear on duration are, on the Desk's numbers, under-hedged against their own oil.
Second- and Third-Order Effects
A hawkish surprise re-tightens dollar liquidity into a market that had begun to fade it — pressuring EM sovereign and corporate refis, widening the funding basis, and testing the private-credit marks that have been carried at generous discount rates. A dovish surprise, conversely, would be read as the Fed blinking at labor weakness while inflation is visibly re-accelerating — a credibility cost that steepens the long end even as the front rallies.
Watch Dashboard
Between now and 29 July: Brent's close each session (the Desk's single most informative variable); weekly EIA inventories and any Hormuz transit-insurance repricing; the 17 July initial-claims print for labor confirmation; Fedspeak in the pre-meeting window for any signal the hike camp is gaining or losing members. A Brent move back below $75 collapses the tail; a sustained break above $95 doubles it.
Red-Team — How This Could Be Wrong
The base case over-weights Fed patience: a committee that revised its dots up and has 9 members already at "hike" may not need the shock to fully play out to move. Conversely, the tail may be too generous — energy shocks have repeatedly proved shorter-lived than feared in this cycle, and the Fed has consistently looked through supply-driven headline spikes to core. And the whole exercise assumes the meeting calendar holds; a genuine Hormuz closure would make the funds rate a second-order concern behind a global growth shock.
Methodology Box
Ordered-latent Fed reaction model, 50,000 Monte Carlo paths, fixed seed 20260716, output reproducible bit-for-bit. Latent drivers calibrated to the 16 July 2026 information set: June CPI (BLS, 14 July), June Employment Situation (BLS, 2 July), the 17 June FOMC statement and Summary of Economic Projections, and fed funds futures. Scenario weights are the Desk's judgment, expressed as — and reconciled to — the simulated distribution. Market-implied probabilities are an illustrative futures snapshot. Not investment advice.
Source Ledger
- BLS — Consumer Price Index, June 2026 (released 14 July 2026)
- BLS — Employment Situation, June 2026 (released 2 July 2026)
- Federal Reserve — FOMC statement, 17 June 2026
- Federal Reserve — FOMC minutes, June 2026
- CNBC — June 2026 CPI report
- CNBC — June 2026 jobs report
- CNBC — Oil, Iran and the Strait of Hormuz
- CME Group — FedWatch Tool