Who Gets Crowded Out When Big Tech Borrows a Trillion
The Probability Desk — Wednesday, July 1, 2026
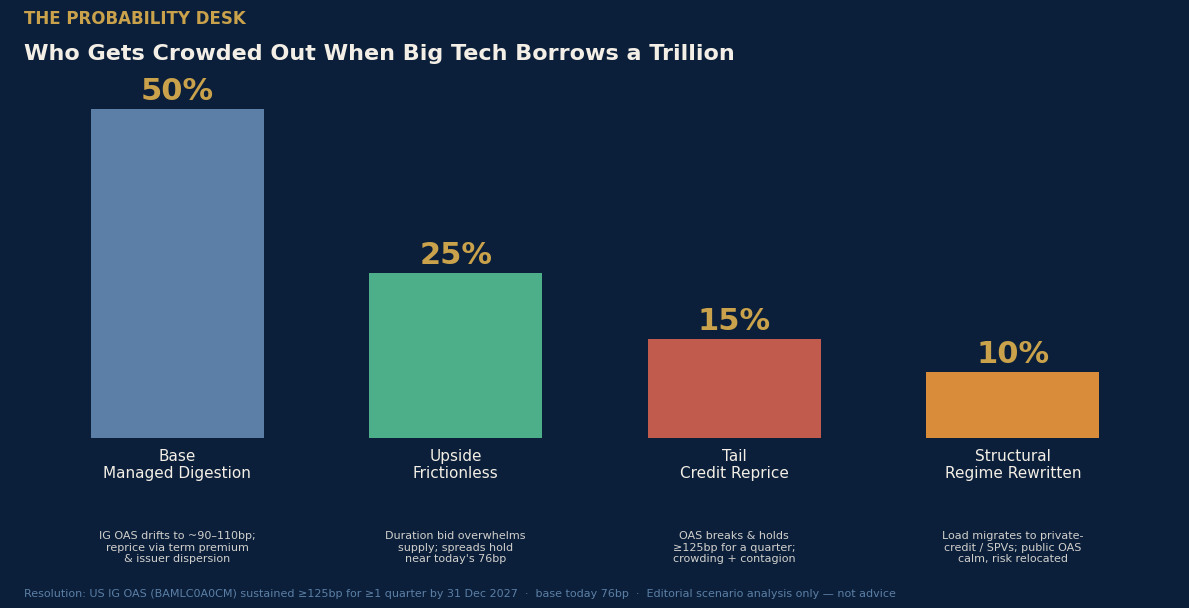
Desk view in one paragraph. The AI build-out has become the largest new claim on the world's highest-quality credit markets since the post-2020 issuance surge. AI-linked borrowers sold on the order of $250–300 billion of bonds in the first half of 2026 (roughly $236 billion confirmed by end-May); Morgan Stanley sees about $250–300 billion of hyperscaler-and-joint-venture issuance this year, part of an AI-related total it puts near $570 billion, and J.P. Morgan estimates the data-center build-out will pull some $1.5 trillion of investment-grade bonds over five years. That supply is landing into the tightest investment-grade credit market in three years — US IG option-adjusted spreads closed the half at just 76 basis points, near their cyclical floor. The Probability Desk probability-weights the question of whether this wave reprices the IG credit that pensions and insurers hold as ballast. Our modal case (50%) is managed digestion: spreads drift wider but stay contained, and the adjustment shows up in term premium and issuer dispersion rather than a systemic blowout. We put a frictionless outcome at 25%, a genuine credit reprice / crowding break at 15%, and a financing-regime rewrite — the load quietly migrating off public balance sheets into private-credit SPVs — at 10%. The number to watch is IG OAS through 125bp for a sustained quarter; our 50,000-path simulation puts that at roughly 12%.
Editorial scenario analysis only. Not investment, actuarial, or geopolitical advice.
The Trigger
The first half of 2026 closed on June 30 with a running tally that reframes a familiar story. AI-related issuers have sold on the order of $250–300 billion of bonds year-to-date (roughly $236 billion confirmed by end-May, with June adding Nvidia's $25bn and other deals). Morgan Stanley sees hyperscaler-and-joint-venture issuance near $250–300 billion this year — part of an AI-related total it puts close to $570 billion, about double 2025's roughly $165 billion, against a 2020–2024 average near $28 billion a year for the five largest names (Amazon, Alphabet, Meta, Microsoft, Oracle) (Reuters/Yahoo Finance, June 2026; Morgan Stanley). The half was punctuated on June 15, 2026 by Nvidia's $25 billion investment-grade offering — its first debt sale since 2021 — which drew about $85 billion of orders, the largest IG deal of the year by a chip issuer (Tech Times, June 16, 2026).
Nvidia was not an outlier; it was a capstone. Earlier in 2026 Meta placed roughly $25 billion in a six-part IG sale a day after lifting its 2026 capex range to $125–145 billion, drawing about $96 billion of orders; Oracle sold $25 billion to a record ~$129 billion order book; and Alphabet raised $20 billion in a seven-part February deal that included a 40-year tranche and the first century bond from a technology company since Motorola in 1997 (PitchBook; CNBC; Fortune, Mar 2026). Layered on top is a parallel private market: in October 2025, Meta and Blue Owl closed a ~$30 billion financing for the Hyperion data center in Louisiana, an off-balance-sheet SPV that issued roughly $27 billion of A+-rated debt anchored by PIMCO (~$18bn) and BlackRock (~$3bn), for a 5-gigawatt site (Private Equity Insights; DCD; Meta investor release, Oct 2025).
The trigger, then, is not a single deal but a threshold: at the half-year mark, the AI build-out has confirmed itself as a structural, multi-year supply event in exactly the part of the credit market that long-horizon owners treat as their safe ballast.
The Forecast Question
By December 31, 2027, will the AI-infrastructure funding wave have produced a portfolio-material reprice of US investment-grade credit for universal owners — defined as US IG corporate OAS (FRED BAMLC0A0CM) sustained at or above 125 basis points for at least one calendar quarter, and/or a visible AI-issuer funding-cost step-up or rating migration — or will the market absorb the supply with spreads range-bound below that line?
Resolution metric: the ICE BofA US Corporate Index OAS, cross-checked against single-name AI-issuer spreads and rating actions. Horizon: 18 months. Base reading: 76bp on 2026-06-30. The 125bp line is deliberate — it sits at roughly the top decile of the last three years' range (3-year max 133bp) and is a level that, if sustained, would raise the marginal cost of high-grade capital for every IG borrower, not just the technology names.
Prior / Base Rate
Three analogues anchor the outside view.
1998–2001, the telecom/fiber build-out. Debt-financed capital expenditure ran years ahead of realized demand; the unwind produced landmark defaults (WorldCom, Global Crossing) and a multi-year credit repricing. The caution is real — but the financing was overwhelmingly high-yield and leveraged, at negative-cash-flow carriers, not investment-grade issuance by the most cash-generative companies on earth. It sets the shape of the risk (capex ahead of revenue) without matching the credit quality.
2020, the record IG supply surge. US investment-grade issuers sold roughly $1.7 trillion of bonds in a single year — a supply shock far larger than today's AI wave — and spreads tightened through it, because a Fed backstop and structural demand for duration overwhelmed supply. The lesson: heavy supply alone does not widen spreads; it takes a demand shock or a macro trigger to do that.
2015–2016, energy capex and credit. A commodity bust widened high-yield energy spreads sharply and spilled modestly into IG, but the damage stayed sector-contained and did not become a market-wide IG blowout. The lesson: single-sector capex stress can be absorbed by a diversified IG index unless it coincides with a broader risk-off.
The base rate that emerges: sustained, market-wide IG spread blowouts to the top of the range are overwhelmingly recession- or crisis-driven, not supply-driven. Absent a macro shock or a credit event at a major issuer, large well-flagged supply waves have historically been absorbed. That anchors a high base case and a modest — but non-trivial — tail.
Evidence-Update Table
Prior (from base rate): P(sustained IG reprice ≥125bp by YE2027, absent recession) ≈ 10–12%. Evidence then moves it:
| # | Evidence (dated, sourced) | Direction | Strength | Effect on posterior |
|---|---|---|---|---|
| 1 | AI issuers ~$250–300bn H1 2026 (~$236bn by end-May); MS ~$250–300bn FY hyperscaler (~$570bn all-AI); JPM ~$1.5tn IG/5yr (Jun 2026) | ↑ widening | Medium | Real net-supply pressure, but flagged and staggered → +2–3pt |
| 2 | IG OAS 76bp, near 3-yr low; index rich vs 93bp mean (FRED, 2026-06-30) | ↑ widening | Medium | Little cushion; mean-reversion room → +2pt |
| 3 | Order books 3.4–5.2x covered (Meta 96/25; Oracle 129/25; Nvidia 85/25) | ↓ widening | High | Demand for high-grade duration is deep → −4pt |
| 4 | Pension de-risking + insurer bid for long IG (structural allocator demand) | ↓ widening | Medium | A natural buyer for the exact supply → −2pt |
| 5 | Capex-to-revenue gap widening; EV/EBITDA ~25x, near telecom-2000 (Forbes, Jun 2 2026) | ↑ widening | Medium | Raises odds capex outruns cash flow → +3pt |
| 6 | Off-balance-sheet SPV/private-credit financing (Meta–Blue Owl $30bn) absorbing load | ↓ public-OAS widening | Medium | Diverts supply off the IG index → −3pt (but shifts risk, not removes it) |
| 7 | Rates backdrop stable: 10Y 4.38%, 2s10s +30bp, VIX 16.5 (FRED, late Jun 2026) | ↓ widening | Medium | No macro stress trigger present today → −2pt |
| 8 | Single-name concentration: mega-issuers with rising leverage & downgrade watch | ↑ dispersion | Medium | Idiosyncratic > systemic; migration risk → +2pt to dispersion, +1pt tail |
Net posterior: P(sustained ≥125bp reprice) ≈ 12% (simulation-confirmed below), with the more likely outcome a modest widening toward ~100bp and a sharp rise in dispersion between AI-heavy and other issuers.
The Scenarios
Weights are the Probability Desk's, ensembled across base rate, expert priors, and the Monte Carlo, then rounded to 5%.
Base — "Absorbed / Managed Digestion" — 50%. The IG market takes the supply. Deep demand from pensions de-risking into long duration and insurers matching liabilities meets the calendar; spreads drift from 76bp toward the ~90–110bp region but do not sustain above 125bp. The adjustment mostly shows up in term premium (a steeper long end) and in dispersion — AI-heavy issuers pay a few tens of basis points more than the index — rather than in a market-wide blowout. Resolving indicator: IG OAS spends the horizon mostly in the 85–120bp band; no sustained quarter ≥125bp.
Upside — "Frictionless Financing / Productivity Bid" — 25%. The structural bid for high-quality yield simply overwhelms supply. Order books stay multiples-covered, AI revenue growth keeps pace with capex enough to protect ratings, and IG spreads stay near today's tight levels. Universal owners who feared a reprice instead find the safe-ballast book quietly compounding. Resolving indicator: IG OAS holds below ~90bp for most of the horizon.
Tail — "Credit Reprice / Crowding Break" — 15%. A trigger — a capex-to-revenue disappointment at one or more hyperscalers, a rating migration on a mega-issuer, or a broader risk-off — converts the supply overhang into a genuine reprice. IG OAS pushes through 125bp and holds; crowded-out non-tech issuers pay up or postpone; the stress transmits into private-credit data-center vehicles and the AI equity complex. This is the world in which the safe part of the portfolio stops being safe. Resolving indicator: IG OAS sustained ≥125bp for ≥1 quarter; simulation probability ≈ 12%.
Structural — "Financing Regime Rewritten" — 10%. The public IG market looks calm precisely because the marginal financing has moved off it — into off-balance-sheet SPVs, private-credit consortia, and insurance-affiliated direct lending of the Meta–Blue Owl type. Public OAS stays contained, but the risk has been relocated to less-transparent, less-liquid wrappers held increasingly by the very insurers and private-credit funds universal owners are allocating to. The metric passes; the exposure grows anyway. Resolving indicator: public IG OAS range-bound while data-center private-credit/SPV issuance share keeps rising and shows up in insurer and BDC books.
The Monte Carlo
We model US IG OAS as a mean-reverting (Ornstein–Uhlenbeck / AR(1)) diffusion estimated from the FRED daily series, with two overlays: a supply-pressure reversion level drawn per path (centred ~1.02%, reflecting absorption of the AI calendar lifting the equilibrium off today's 76bp toward the historical ~93bp mean), and a fat-tailed regime-jump whose daily intensity is scaled by a latent capex-to-revenue gap stress factor (Beta-distributed across paths). Calibration from 785 daily observations: daily mean-reversion κ≈0.0063, daily diffusion σ≈0.0135, historical mean 0.928%, historical max 1.33%. 50,000 paths, seed 20260701, horizon 378 business days to 2027-12-31. Code and outputs ship in mc.py / mc_terminal.npy.
Terminal IG OAS (2027-12-31), percentiles: P5 74bp · P10 79bp · P25 90bp · P50 102bp · P75 115bp · P90 128bp · P95 138bp.
Threshold probabilities: P(terminal ≥100bp) = 54% · P(terminal ≥125bp) = 12.4% · P(sustained ≥125bp for ≥1 quarter) = 11.8% · P(ever ≥150bp intra-path) = 16.5% · P(terminal ≥150bp) = 2.5% · P(stays tight, <90bp) = 25.3%.
Raw simulation buckets: base (managed digestion) 63.5% · upside (stays tight) 24.8% · tail (sustained reprice) 11.8%. The published weights carve ~10 points out of the base bucket for the qualitative Structural regime-rewrite outcome the OAS metric cannot see, and lift the Tail to 15% (from the simulation's 11.8%) to capture the broader reprice definition — rating migration and a funding-cost step-up, not only the OAS threshold, plus the 16.5% intra-path probability of a ≥150bp spike.
Limitations: the model is single-factor on the spread and does not endogenize a full recession; the jump process is a reduced-form stand-in for a credit or macro trigger; the historical calibration window (~3 years) is a tight-spread regime, which if anything understates tail vol relative to a full cycle. Read the tail as a floor, not a ceiling.
Market vs Desk View
The market is pricing this as absorbable. IG OAS at 76bp, order books covered several times over, and a contained rates backdrop (10Y 4.38%, 2s10s +30bp, VIX 16.5) all say "supply, not stress." The Desk broadly agrees on the modal path — but sees two things consensus underweights. First, the market is pricing index risk while the real action is dispersion: the gap between AI-heavy issuers and everyone else is where the mispricing lives, and it is not in the index number. Second, the calm public-OAS print is partly an artifact of financing migrating into private and off-balance-sheet channels where it is not marked to a visible spread — a composition change that flatters the headline metric while concentrating risk in insurer and private-credit books. Highest-conviction call: the safe-ballast IG book will be repriced less than bears fear at the index level, but the quality and transparency of that ballast is quietly deteriorating in ways the OAS number will be the last to show. What would prove the Desk wrong: a clean, sustained break above 125bp with no macro trigger, driven purely by supply — which would mean demand for high-grade duration is far shallower than the order books suggest.
Universal-Owner Portfolio Heatmap
Direction of reprice by asset class under each scenario (↑ = spreads/cost up / price down for the owner; → = little change; ↓ = favourable). Magnitude bands are indicative over the 18-month horizon.
| Asset class | Base (50%) | Upside (25%) | Tail (15%) | Structural (10%) |
|---|---|---|---|---|
| US IG credit (core ballast) | → / mild ↑ (+15–35bp) | ↓ (tight) | ↑↑ (+50–80bp) | → (masked) |
| AI-heavy IG issuers | ↑ dispersion (+20–50bp) | → | ↑↑↑ (migration) | ↑ (moves to SPV) |
| Crowded-out non-tech IG | mild ↑ (calendar) | → | ↑↑ (pay up / defer) | → |
| High yield | → / mild ↑ | ↓ | ↑↑ | mild ↑ |
| Private credit / data-center SPVs | ↑ share, → marks | → | ↑↑ (stress surfaces) | ↑↑↑ (absorbs load) |
| Long-duration govvies / rates | ↑ term premium | → | ↓ (flight to quality) | → |
| AI / mega-cap equity | → | ↑ | ↓↓ (capex de-rate) | → |
| Utilities / power infrastructure | ↑ demand, ↑ capex | ↑ | mixed | ↑ |
| Insurance / reinsurance balance sheets | ↑ private-asset load | → | ↑↑ (mark risk) | ↑↑ (hidden load) |
| Gold / reserves | → | → | ↑ (hedge bid) | → |
The universal-owner point: because these funds own the IG book, the crowded-out issuers, the private credit, the insurers, and the AI equity, they are on every side of this trade at once. The risk is not any single line; it is the correlation — a Tail world hits the ballast, the private credit, and the equity together.
Second- and Third-Order Effects
The build-out's financing has power as its binding physical constraint. IEA projects global data-center electricity demand roughly doubling from ~485 TWh in 2025 to ~950 TWh by 2030 (~3% of global demand), with US consumption up ~240 TWh (+130%) and AI-accelerated server load growing ~30% a year (IEA, Electricity 2026 / Energy and AI). That drags utilities into their first major capex cycle in two decades and turns grid interconnection queues into a gating factor on whether the bonds' proceeds can actually be deployed — a second-order link between the credit story and the power story.
Third-order: as more of the build-out is financed through off-balance-sheet SPVs and private credit (Meta–Blue Owl the template), the risk migrates toward insurers and BDCs — the same vehicles pensions and sovereigns have been allocating to for yield. A Tail credit event would therefore surface not in the transparent public index but in the least-liquid, least-marked corners of allocator portfolios, echoing the private-credit fragility the Desk flagged on June 26. Meanwhile, crowding-out is a quiet tax on the rest of the economy: every dollar of high-grade capacity absorbed by AI is a dollar a utility, a REIT, or an industrial issuer competes for at a slightly higher clearing spread.
Watch Dashboard
| Indicator | Current | Threshold that moves the model |
|---|---|---|
| US IG OAS (BAMLC0A0CM) | 76bp (06-30) | >125bp sustained → Tail; <90bp held → Upside |
| US HY OAS (BAMLH0A0HYM2) | 275bp (06-30) | >400bp → risk-off confirming Tail |
| AI-issuer vs index spread gap | modest | widening >40bp → dispersion/Tail lean |
| Hyperscaler quarterly capex guides | rising ($125–145bn Meta) | cut/miss vs revenue → capex-gap trigger |
| AI-issuer rating actions | stable IG | any downgrade of a mega-issuer → Tail |
| IG net supply / order-book cover | 3–5x covered | cover <2x on a marquee deal → demand fatigue |
| Data-center private-credit/SPV issuance share | rising | accelerating → Structural |
| 10Y UST / term premium | 4.38% | term-premium spike → widening pressure |
| 2s10s | +30bp | inversion → recession risk, Tail lean |
| VIX / credit vol | 16.5 | >25 sustained → macro trigger |
| Insurer private-asset allocation | rising | regulatory scrutiny → Structural surfaces |
| BDC bad-PIK / NAV marks | watch | rising → private-credit stress |
| IEA/grid interconnection backlog | growing | worsening → deployment friction |
| Capex-to-revenue gap (AI complex) | widening | further widening → Tail lean |
| Fed policy path | on hold | cuts on growth scare → mixed signal |
Red-Team — How This Could Be Wrong
The base case is too sanguine on demand depth. The order books that anchor the Upside and Base cases reflect a three-year regime of scarce yield and heavy allocator cash. If pension de-risking flows slow (as funded ratios normalize) or insurers pull back, the "natural buyer" thesis weakens and even a well-flagged calendar could clear at materially wider spreads — a pure supply-driven widening our base rate says is rare but our tight starting point makes cheaper than usual.
The metric is the wrong metric. By choosing public IG OAS as the resolution variable, we may declare "no reprice" while the actual risk balloons in private and SPV channels the index never touches. The Structural scenario tries to capture this, but if it is closer to 25% than 10%, the report's headline reassurance is misplaced — the danger simply isn't where we're looking. This is the single weakest assumption.
The tail is under-weighted because the calibration window is too calm. Our σ and κ come from a ~3-year tight-spread era. A full-cycle calibration (2008, 2020, 2022) would fatten the tail and could lift P(≥125bp) well above 12%. If a recession arrives inside the horizon, the AI supply overhang becomes an accelerant, not the cause, and the Tail is the base case. What would falsify the modal call: IG OAS breaking and holding above 125bp with VIX still sub-20 and no recession — supply alone doing the damage — or, conversely, spreads grinding tighter through a record calendar, which would vindicate the Upside outright.
Methodology Box
Probabilities are the UAO Probability Desk's, weighted across base-rate, expert-prior, and multi-agent/Monte-Carlo simulation inputs, per 08-probability-desk-methodology.md. The base rate is the historical frequency of sustained market-wide IG spread widening absent recession; expert priors are dated, cited house views (Morgan Stanley, J.P. Morgan, Goldman Sachs, bond-manager commentary); the simulation is the 50,000-path Ornstein–Uhlenbeck spread model documented above (seed 20260701, reproducible). Weights are rounded to 5% and sum to 100%. Live macro figures pulled from FRED via research/data_spine.py. Methodology available on request.
Disclaimer: This report is for informational and research purposes only and does not constitute investment, legal, tax, or financial advice. Editorial scenario analysis only — not investment, actuarial, or geopolitical advice.
Source Ledger (selected)
- Reuters/Yahoo Finance — AI hyperscalers to drive higher US corporate bond supply; ~$250–300bn H1 2026 (~$236bn by end-May); MS ~$250–300bn hyperscaler FY (~$570bn all-AI); 2025 $121bn vs $28bn/yr 2020–24 (Jun 2026). H.
- Tech Times — Nvidia $25bn bond deal, ~$85bn orders, Jun 16 2026. H.
- PitchBook — Meta ~$25–30bn six-part IG sale; capex raised to $125–145bn (2026). H.
- Fortune — Google/Meta/Oracle ~$1tn borrowing; Alphabet $20bn Feb incl. 40yr + first tech century bond since Motorola 1997 (Mar 7 2026). M.
- CNBC — Oracle $50bn funding plan; $25bn to record ~$129bn order book (Feb 2 2026). H.
- Private Equity Insights / DCD / Meta investor release — Meta–Blue Owl ~$30bn Hyperion SPV, ~$27bn A+-rated debt anchored by PIMCO (~$18bn) and BlackRock (~$3bn) plus ~$2.5bn equity, arranged by Morgan Stanley, 5GW Louisiana (Oct 2025). H.
- Goldman Sachs — AI capex ~$765bn 2026 → $1.6tn 2031; ~$7.6tn cumulative 2026–31. M.
- J.P. Morgan — data-center build-out ~$1.5tn IG bonds over 5 years. M.
- IEA — Electricity 2026 / Energy and AI: data-center demand ~485→950 TWh 2025–30; US +240 TWh (+130%); accelerated servers +30%/yr. H.
- Forbes — AI capex-to-revenue gap widening; markets repricing (Jun 2 2026). M.
- FRED (data_spine) — IG OAS BAMLC0A0CM 0.76% (06-30); HY OAS 2.75%; DGS10 4.38%, DGS30 4.86%, DGS2 4.10% (06-29); T10YIE 2.24%; VIXCLS 16.45; DCOILBRENTEU $76.49 (06-22). H.
- Historical analogues: 1998–2001 telecom/fiber defaults; 2020 ~$1.7tn IG supply absorbed; 2015–16 energy credit. M.
Continue the briefing. Read the daily brief · watch the daily video briefing · listen to The Universal Owner · view the chart of the day.
Produced and edited by the UAO editorial desk. Not investment advice.