
The Probability Desk — Published Monday, June 22, 2026 · Updated through Tuesday, June 24, 2026
A probability-weighted scenario report from the UAO Probability Desk. Editorial scenario analysis only. Not investment, actuarial, or geopolitical advice.
Updated through June 24, 2026. Market levels have moved modestly since first publication. As of June 24, the 10-year JGB trades near 2.67% and the 30-year near 3.88% (Trading Economics). The yen sits around 161 to the dollar, keeping intervention risk live (Reuters, June 19). The Bank of Japan's June 24 Summary of Opinions shows some board members arguing for further rate increases, citing inflation-overshoot risk — consistent with the regime read below.
Executive Summary
For a generation, Japanese rates helped anchor the global cost of long-term money. That anchor is repricing. On June 16, the Bank of Japan raised its policy-rate guideline to around 1.0% by a 7–1 vote, its highest level since 1995, and stated that it will continue adjusting policy as inflation and financial conditions evolve. The 30-year JGB is now trading around the high-3% range (3.84% on June 19, ~3.88% on June 24), while the 40-year has already tested levels above 4% this year. This is not only a Japan story: Japan remains one of the world's largest creditor nations — with record net external assets — and the largest foreign holder of U.S. Treasuries, so a durable rise in domestic yields changes the relative attractiveness of global duration. The key question for universal owners is not simply whether JGB yields rise, but whether the adjustment is orderly, domestically absorbed, or transmitted through repatriation, yen volatility, and global carry unwind.
The Probability Desk reads this as a regime change, not a spike. We put the probability that the 30-year JGB averages at or above 3.50% over the next twelve months at roughly 90% (our 50,000-path simulation returns 95%, conditional on today's starting yield — see the model caveat below); a return to the suppressed sub-3% world is no longer a credible base case. The live question is therefore not if but how: a Managed Higher Plateau (Base, 45%), an Orderly Re-anchoring (Upside for stability, 20%), a Domestic Fiscal Spiral (Tail-A, 20%), or a Global Carry-Unwind Shock (Tail-B, 15%) — a larger replay of August 2024, in which a sharp JGB sell-off and snapback in the yen forces a global de-leveraging.
The Desk View in one paragraph. The market is correctly pricing that Japanese rates are going up; it is underpricing the second-order plumbing. When the world's largest creditor pool can finally earn ~3.8% at home, the marginal yen that funded global carry, bid long-dated US Treasuries, and underwrote European credit has a reason to come home. The mispricing is not in the JGB itself. It is in everything the suppressed JGB used to subsidise.
Situation as of today (June 22, updated June 24, 2026)
Japan has crossed from "exiting deflation" to "normalising into a fiscal-expansion regime," and the two forces now pull the curve in the same direction. On the monetary side, the BOJ's June 16 hike to 1.0% passed on a firm 7–1 vote (board member Asada dissenting), a clear hardening from the Board's earlier hold. Governor Ueda missed the meeting for medical treatment, leaving Deputy Governors Himino and Uchida to manage the decision and communications; the Board's data-dependent guidance held. Three days later, Deputy Governor Himino was more explicit that the hiking path continues while the Board watches for underlying inflation overshooting 2%. The June 24 Summary of Opinions reinforced that some members favour further increases. The 10-year JGB sits near 2.67% (June 24), having pushed above 2% for the first time in two decades over the winter.
On the fiscal side, Prime Minister Sanae Takaichi's program — the market's "Takaichi trade" of a stronger Nikkei, weaker JGBs, and a weaker yen — has layered structural supply pressure onto the super-long curve. The FY2026 general-account budget runs ¥122.3 trillion, with debt-servicing costs jumping 10.8% to ¥31.3 trillion on an assumed 3.0% interest rate (the highest assumption in 29 years); finance-ministry estimates have debt-service rising further toward ¥40.3 trillion by FY2029. On the IMF Global Debt Database measure, Japan's general-government debt is about 237% of GDP; other international series using different definitions (IMF WEO, OECD) put the ratio closer to 200–205%. The precise series matters less than the direction: higher long yields are now visible in the debt-service math. A May 25 supplementary package added roughly $19 billion for fuel and cost-of-living subsidies. The January session that drove the 40-year above 4% for the first time, and produced the largest single-day move in the 30-year since 1999, was the market's down-payment on this combination.
What changed recently: the super-long curve re-tested its cycle highs after Himino's June 19 remarks (30-year at 3.84%, ~3.88% by June 24), crystallising that the post-hike repricing is not retracing. That is the trigger for this scenario run.
The Trigger
Named, dated, primary-sourced: On June 19, 2026, after BOJ Deputy Governor Ryozo Himino reaffirmed the Bank's intent to keep raising rates, the 30-year JGB yield closed at 3.84% (Trading Economics), holding near the top of its post-pandemic range, three days after the BOJ's June 16 hike to a 1.0% policy rate (CNBC/Trading Economics). By June 24 the 30-year was near 3.88%. The super-long curve is no longer treating the reset as temporary.
The Forecast Question
Over the twelve months to June 30, 2027, will the 30-year JGB yield average at or above 3.50% — confirming a durable term-premium regime reset in one of the world's largest creditor nations — and will the adjustment transmit in an orderly (domestically absorbed) or a disorderly (carry-unwind / global-bond-spillover) fashion?
Resolution criteria: the 12-month simple average of the daily 30-year JGB yield to June 30, 2027 (level test, ≥3.50%); and a transmission test — a disorderly outcome is defined as any ≥50bp rise in the 30-year over a rolling 20 trading days combined with an intra-year peak ≥4.30% and a measurable global risk event (the carry-unwind channel). Horizon: 12 months. The scenario will be graded against the public resolution criteria stated above.
Prior / Base Rate — historical analogues
Three reference episodes anchor the outside view before any narrative.
1. Japan, August 2024 — the carry-unwind dress rehearsal. When the BOJ's July 2024 hike and a firmer yen collided with a soft US payroll print, the unwind of yen-funded carry produced a violent but brief global drawdown (the Nikkei's worst day since 1987, a VIX spike, and an equally fast recovery). Relevance: it is the cleanest modern template for how a JGB/yen move transmits globally. Why it may mislead: it reversed within weeks because the BOJ blinked and US data stabilised — a soft landing that may not repeat with fiscal expansion now layered on. Implication: the disorderly tail is real and observed, but historically self-correcting, which argues for a fat but not dominant Tail-B.
2. United States, 1994 — the bond-market massacre. A faster-than-expected Fed tightening repriced the entire global curve, blew up leveraged positions (Orange County, Mexican tesobonos), and reset term premium higher for years. Relevance: a creditor reanchoring its risk-free rate forces a global repricing of duration. Why it may mislead: the US is the reserve issuer; Japan's spillover runs through private capital flows, not reserve status. Implication: regime resets, once established, persist — supporting a high Base weight.
3. Eurozone periphery, 2011–12 — the fiscal-spiral analogue. Rising debt-service costs at high debt/GDP, weak auctions, and a self-reinforcing yield-fear loop. Relevance: Japan's high debt/GDP and an assumed 3.0% funding rate make debt dynamics the central fragility. Why it may mislead: Japan borrows in its own currency, holds the large majority of JGBs domestically, and the BOJ owns roughly half the market — a circuit-breaker the periphery lacked. Implication: a domestic spiral (Tail-A) is plausible but bounded by the BOJ's balance-sheet backstop.
Base-rate read: durable resets are the historical mode; disorderly cross-border unwinds occur but tend to self-correct. The outside view favours a high Base, a meaningful but not dominant pair of tails, and a modest orderly-Upside.
Evidence-Update Table (Bayesian)
No probability appears without the evidence that moved it. Prior is the outside view from the analogues above (a durable-but-orderly reset, ~50% base).
| Evidence (dated, sourced) | Direction | Strength | Posterior impact | Confidence |
|---|---|---|---|---|
| BOJ hikes to 1.0% on 7–1 vote, June 16 (highest since 1995) | ↑ reset durability | High | Lifts P(avg≥3.50%) toward 0.9; firms Base | High |
| Himino signals further hikes, June 19; 30Y at 3.84%; June 24 Summary shows members favouring more hikes | ↑ reset, ↑ Tail-A | High | Keeps curve at cycle highs; supports plateau-to-spiral | High |
| Takaichi FY26 budget: debt-service +10.8% at assumed 3.0%; debt-service rising toward ¥40.3tn by FY29; debt/GDP ~237% (IMF GDD) | ↑ Tail-A | High | Structural supply pressure; fattens domestic-spiral tail | High |
| Top life insurers cutting JGB holdings ¥1.3tn ($9.1bn) FY25; midsize cutting super-longs (J-ICS marks both sides) | ↑ Tail-A, ↑ volatility | Medium | Removes a price-insensitive super-long buyer at the margin | Medium |
| Japanese flow data point to episodic selling of US debt in early 2026, though TIC country holdings rose into April | ↑ Tail-B (repatriation channel), flow-sensitive | Medium | Repatriation channel is live but intermittent, not a confirmed sustained liquidation | Low-Medium |
| GPIF ($1.8tn) speculated to tilt toward JGBs / cut foreign bonds | mixed (↓ JGB vol, ↑ UST pressure) | Medium | Domestic backstop for JGBs; pressure on US duration | Low |
| USD/JPY ~161 (June 24) — yen still historically weak | ↓ near-term Tail-B trigger | Medium | A weak yen delays, not cancels, the carry-unwind snap | Medium |
| State Street / R. Katz: super-long weakness not an alarm; "don't buy scare stories" | ↑ Upside, ↓ Tail-B | Medium | Credible counter-view; caps the disorderly tail | Medium |
| BOJ owns ~half of JGBs; large majority held domestically | ↓ both tails | High | Structural circuit-breaker; bounds spiral and unwind | High |
Posterior: a durable reset is near-certain (P(avg≥3.50%) ≈ 0.90–0.95); the orderly Managed Plateau remains the single most likely path; the domestic spiral and the global carry-unwind are genuine, observable tails that the BOJ's balance sheet and the domestic ownership base bound but do not eliminate.
The Scenarios
Weights are the UAO Probability Desk's, blended across base-rate (0.4), expert-prior (0.3), and a 50,000-path simulation (0.3), normalised and rounded to 5%. They sum to 100%.
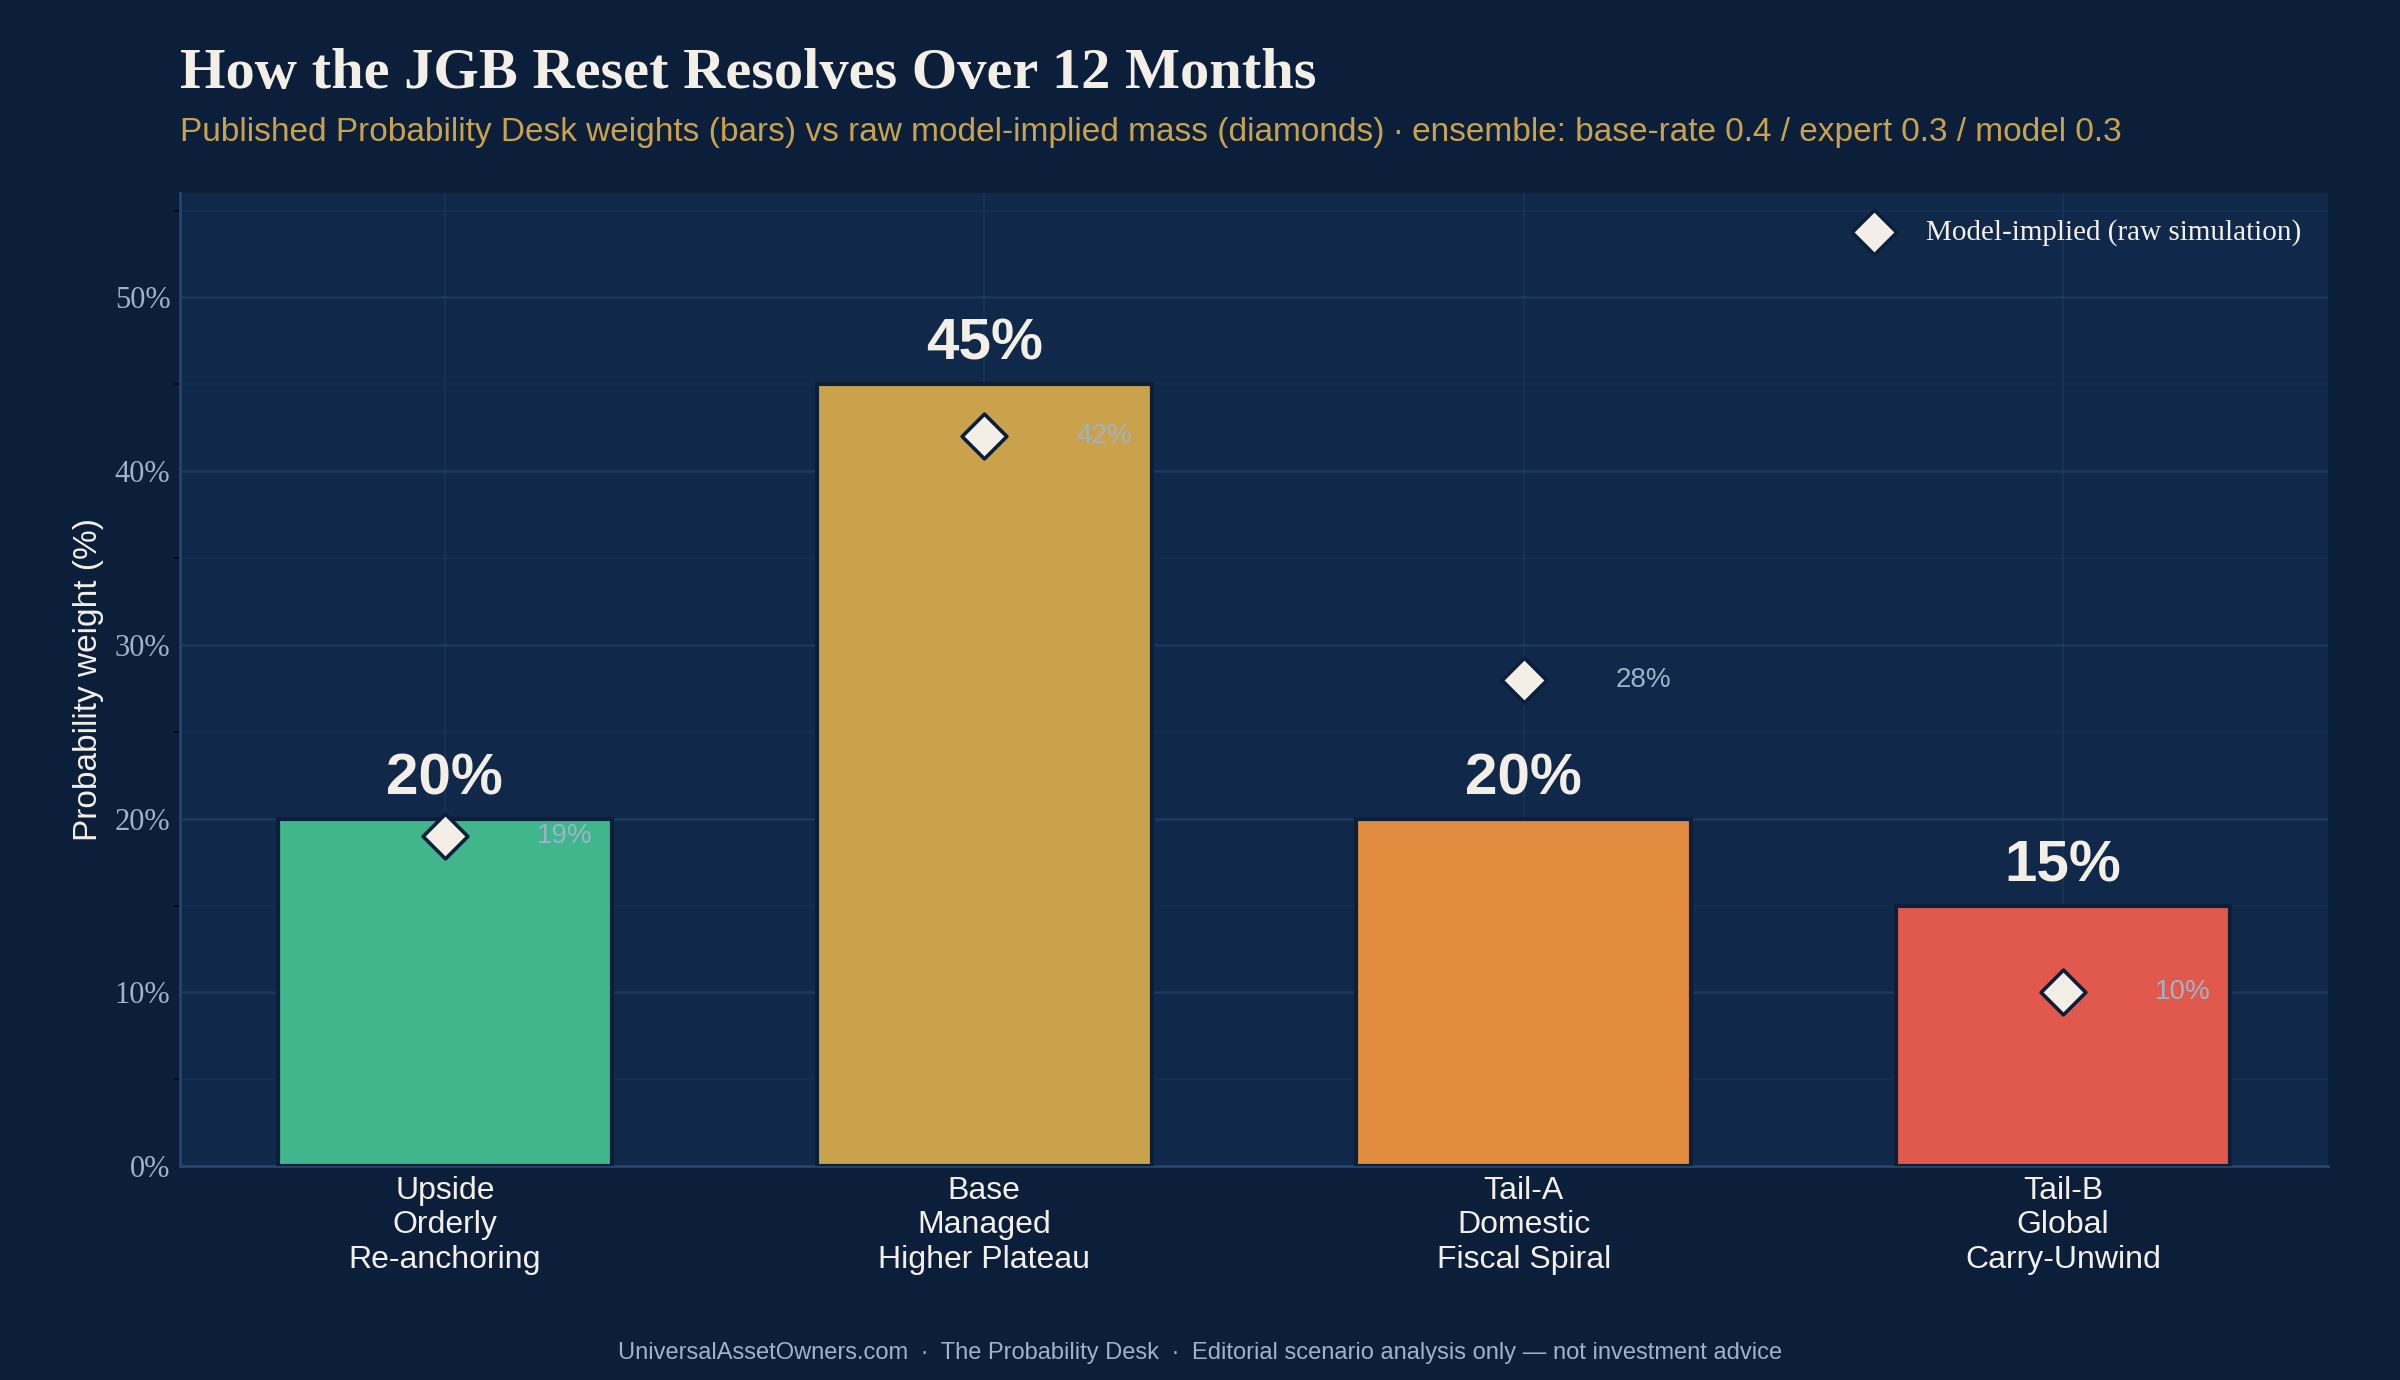
Base — Managed Higher Plateau · 45%
Trigger: the BOJ continues gradual quarterly-ish hikes toward ~1.25–1.5%; the MOF manages super-long supply; domestic buyers (life insurers re-entering at higher yields, GPIF tilting to JGBs, banks) absorb the issuance. Narrative: the 30-year settles into a 3.5–4.0% band, the 12-month average lands around the mid-3.8s, and the repricing is orderly. Volatility is episodic (around auctions and BOJ meetings) but does not become self-reinforcing. The yen firms gradually from ~161, and the carry trade unwinds in slow motion rather than a snap. Resolving indicator: 12-month average 3.50–4.00% with no ≥50bp/20-day spike. This is the world adjusting to a permanently higher Japanese anchor without an accident.
Upside (for stability) — Orderly Re-anchoring · 20%
Trigger: inflation cools faster than the BOJ fears (energy relief, a stronger yen importing disinflation), letting the Board pause near 1.0–1.25%; Takaichi tempers the fiscal impulse and reassures on issuance (as on May 25). Narrative: the super-long curve stabilises at the low end (12-month average below ~3.70%), term premium stops widening, the yen appreciates in an orderly way, and global spillovers stay muted. For owners of duration and risk assets, this is the benign outcome. Resolving indicator: 12-month average below 3.70%, no disorderly episode, peak under ~4.10%. The model assigns this ~19%; expert priors (State Street, Katz) that the alarm is overstated keep it at 20%.
Tail-A — Domestic Fiscal Spiral · 20%
Trigger: a failed or deeply tailing super-long auction, a fiscal-slippage headline, or a faster BOJ path pushes the 30-year decisively through 4.3% toward 4.5–5.0%, with debt-service math becoming the story. Narrative: the reset turns disorderly inside Japan — the term premium spirals on debt-sustainability fear at a high debt/GDP — but the BOJ's balance sheet and the domestic ownership base contain the global spillover. Resolving indicator: 12-month average ≥4.00% or an intra-year peak ≥4.30% without a global risk event. The model puts the high-yield/high-peak mass at ~28%; we publish 20%, reallocating the orderly portion of that band to Base.
Tail-B — Global Carry-Unwind Shock · 15%
Trigger: a sharp JGB sell-off (≥50bp in the 30-year over ~20 trading days) coincides with a fast yen appreciation, forcing leveraged yen-funded positions to unwind globally — a larger, less self-correcting August-2024. Narrative: the snapback in the yen and the repatriation of Japanese capital hit US Treasuries, European credit, EM currencies, and crowded equity longs simultaneously; cross-asset volatility spikes; the global cost of duration resets higher. Resolving indicator: a ≥50bp/20-day 30-year move and an intra-year peak ≥4.30% and a measurable global risk event (VIX>30, HY OAS>450bp, or a >10% global-equity drawdown). The simulation's reduced-form proxy returns ~10%; we publish 15%, with a logged divergence: the single-factor yield model cannot capture cross-asset contagion (its own stated limitation), and both the base rate (August 2024 happened) and expert priors warning of a "JGB time bomb" argue the cross-border tail is fatter than a yield-only model implies.
The Monte Carlo
A real simulation, not an illustration. The simulation was run with a fixed seed (20260622) and archived internally; methodology and outputs are available on request.
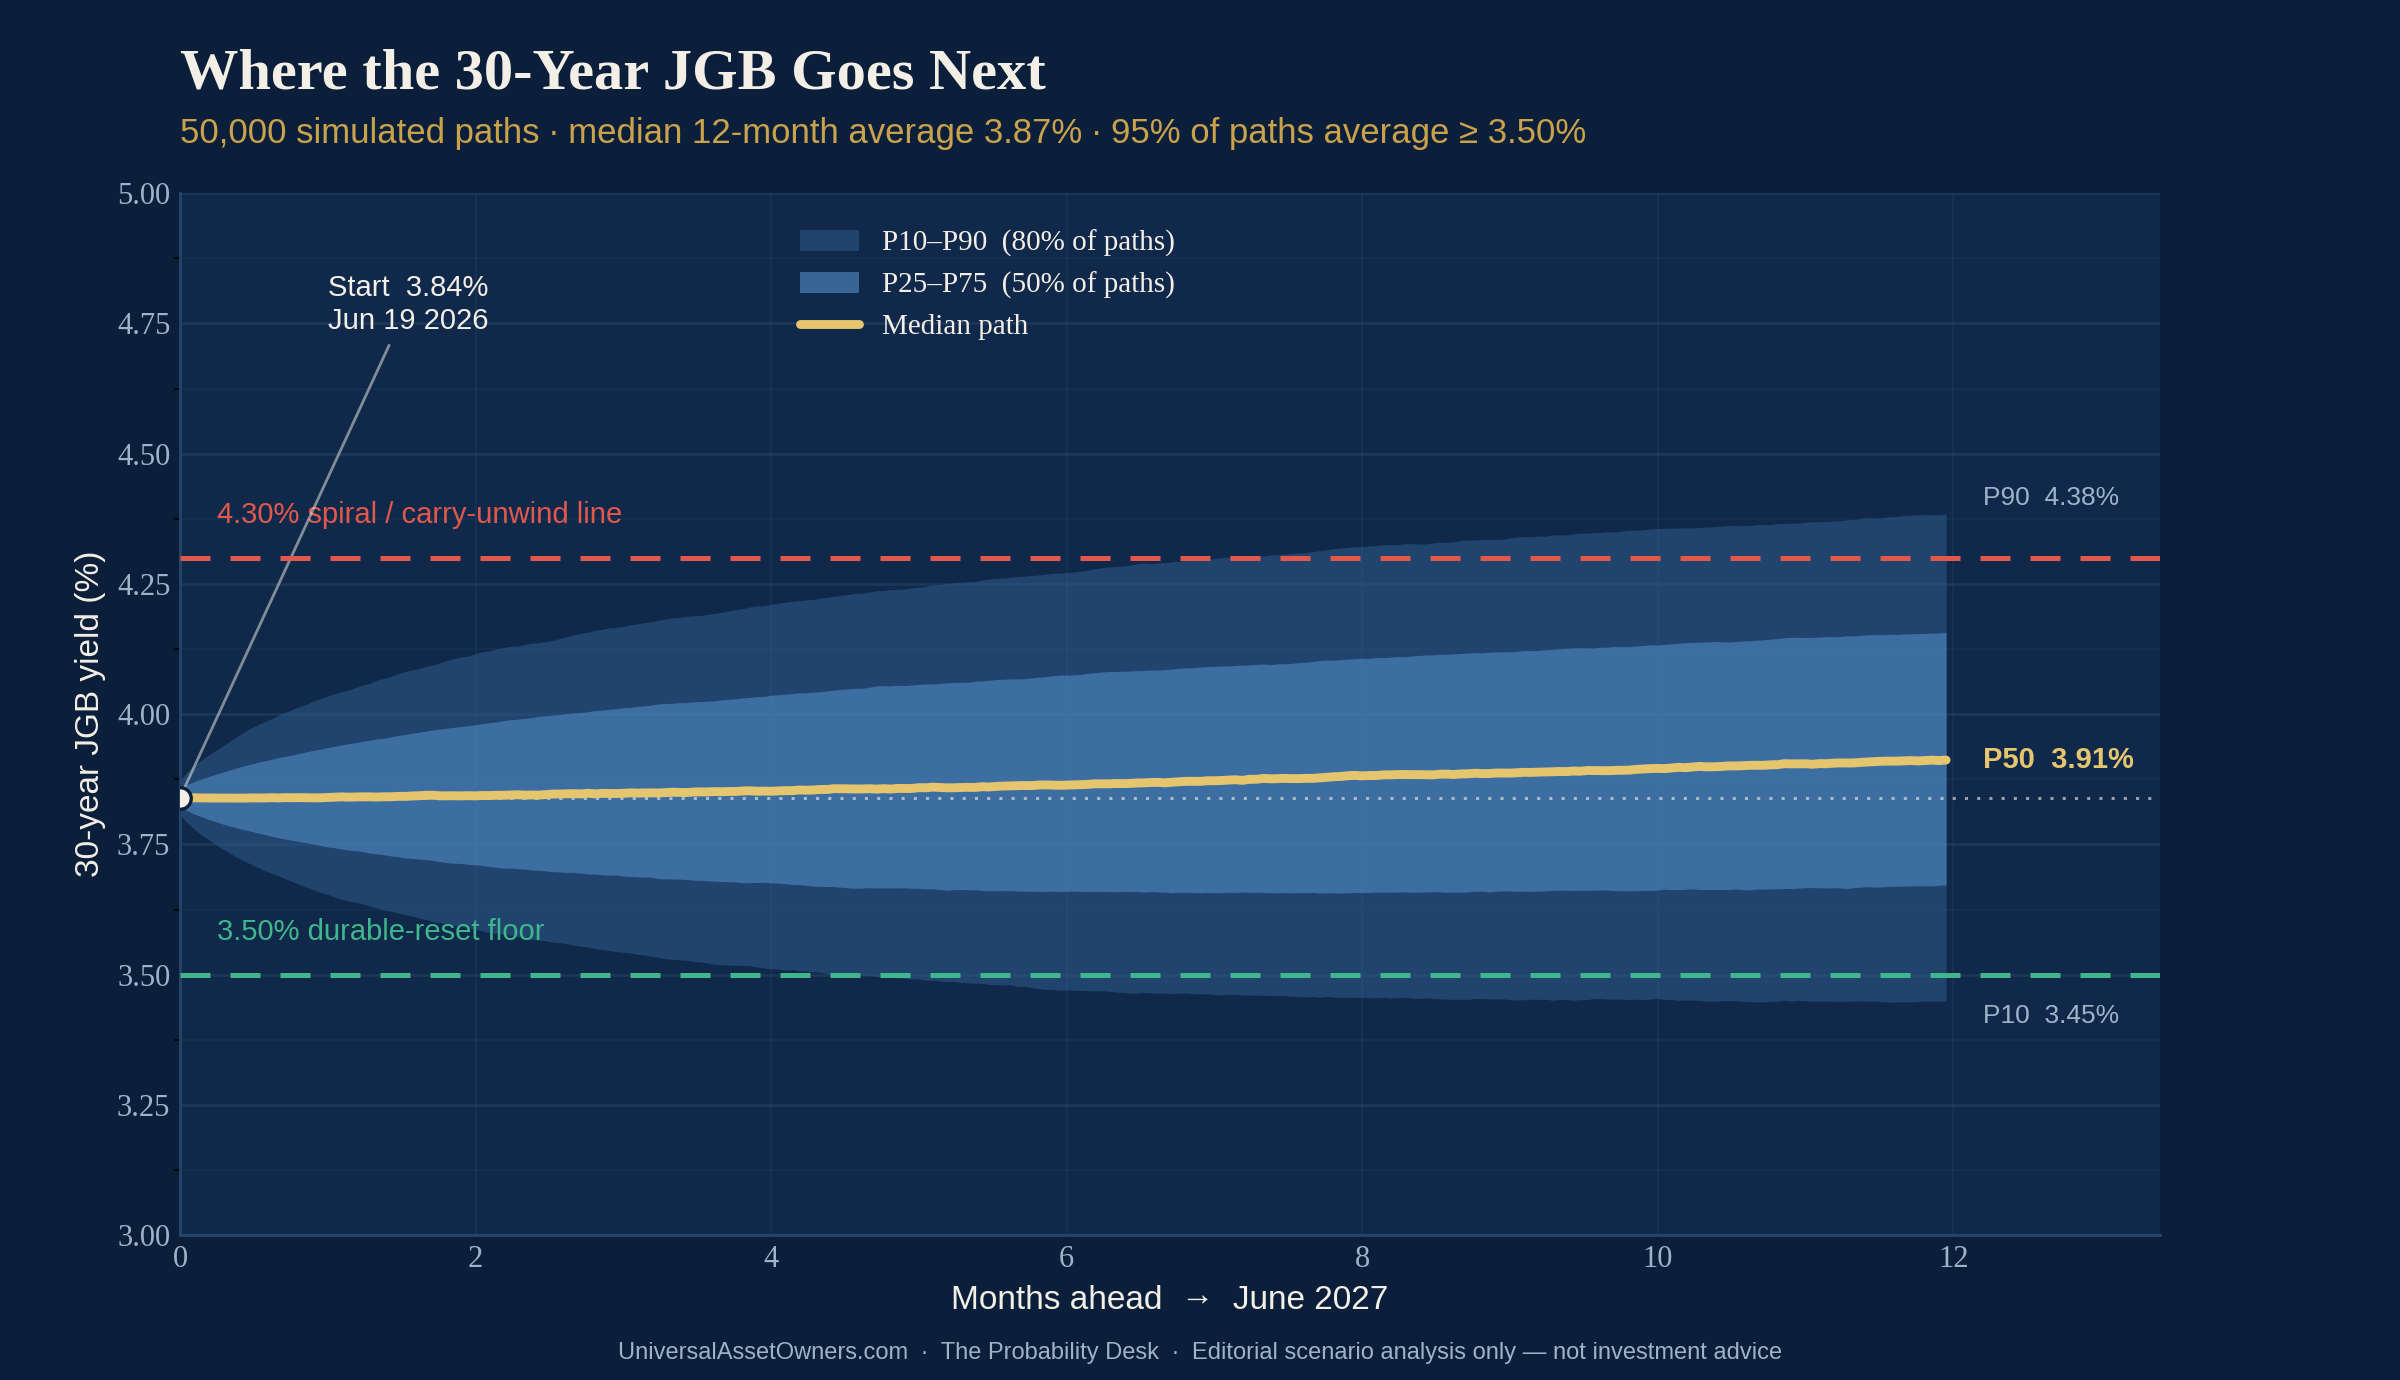
Design. The 30-year JGB yield evolves over 252 trading days as a jump-diffusion with a slowly drifting mean-reversion anchor. The anchor (θ) drifts from 3.78% to 3.92% over the year, capturing gradual BOJ normalisation and entrenching fiscal term premium while keeping the central case a plateau. Mean reversion (κ=1.0) anchors the level; diffusion volatility is 0.40%-pts annualised (~2.5bp/day, elevated versus history but plateau-consistent). Upward jumps (Poisson, ~2.5/yr, mean +16bp) represent fiscal-slippage and auction shocks — the January 2026 40-year blow-out is the reference event; downward jumps (~2.0/yr, mean −15bp) represent BOJ-pause relief and flight-to-JGB episodes. 50,000 paths.
Results.
| Metric | Reading |
|---|---|
| 12-month average 30Y yield — P10 / P25 / P50 / P75 / P90 | 3.58 / 3.72 / 3.87 / 4.02 / 4.17% (mean 3.87) |
| Terminal (2027-06-30) 30Y yield — P10 / P50 / P90 | 3.45 / 3.91 / 4.38% |
| Intra-year peak — P50 / P90 / P95 | 4.20 / 4.60 / 4.72% |
| P(12m average ≥ 3.50%) | 0.95 |
| P(12m average ≥ 3.90%) | 0.45 |
| P(12m average ≥ 4.00%) | 0.28 |
| P(disorderly: ≥50bp rise / 20 days) | 0.14 |
| P(intra-year peak ≥ 4.30%) | 0.36 |
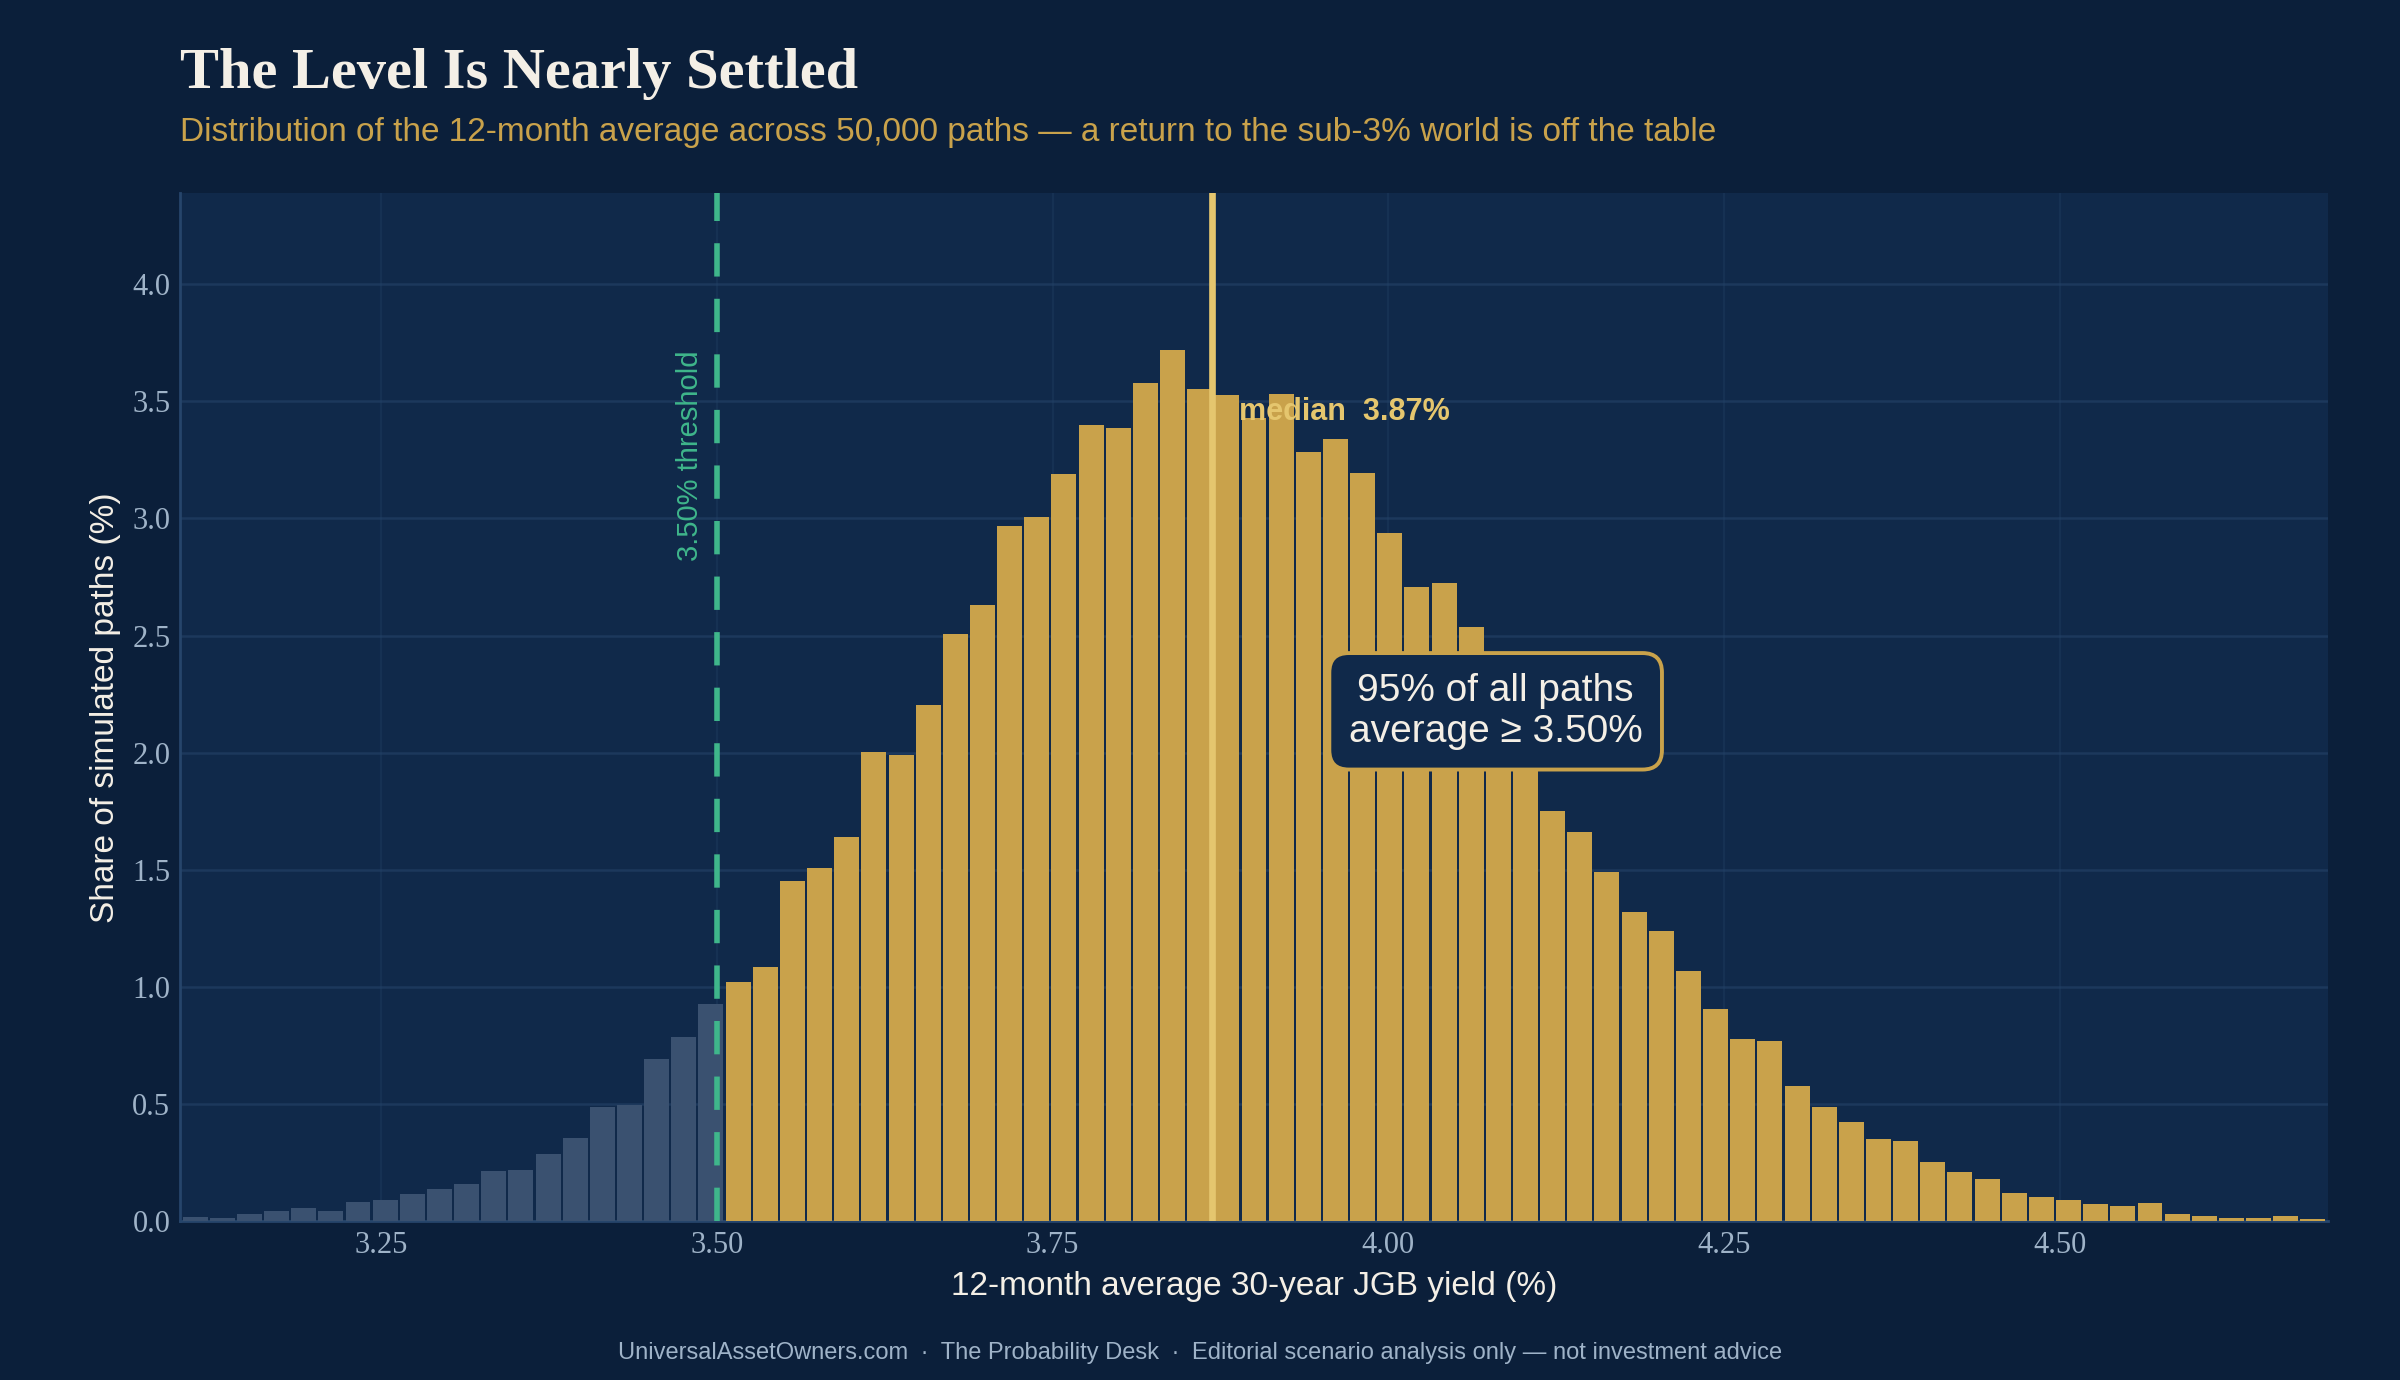
Reading the model honestly. The 95% result is conditional on today's starting yield (~3.8%) and a central anchor in the high-3% range; it should be read as a disciplined scenario input, not an independent proof that the equilibrium yield has permanently reset. Because the simulation largely assumes the regime it is testing, the table below shows how the headline probability and central tendency move when the equilibrium anchor (θ-terminal) is shifted:
| Equilibrium anchor | P(12m avg ≥ 3.50%) | 12m-average median |
|---|---|---|
| 3.40% | 0.83 | 3.71% |
| 3.60% | 0.90 | 3.79% |
| 3.80% (≈ base case) | 0.95 | 3.86% |
| 4.00% | 0.97 | 3.93% |
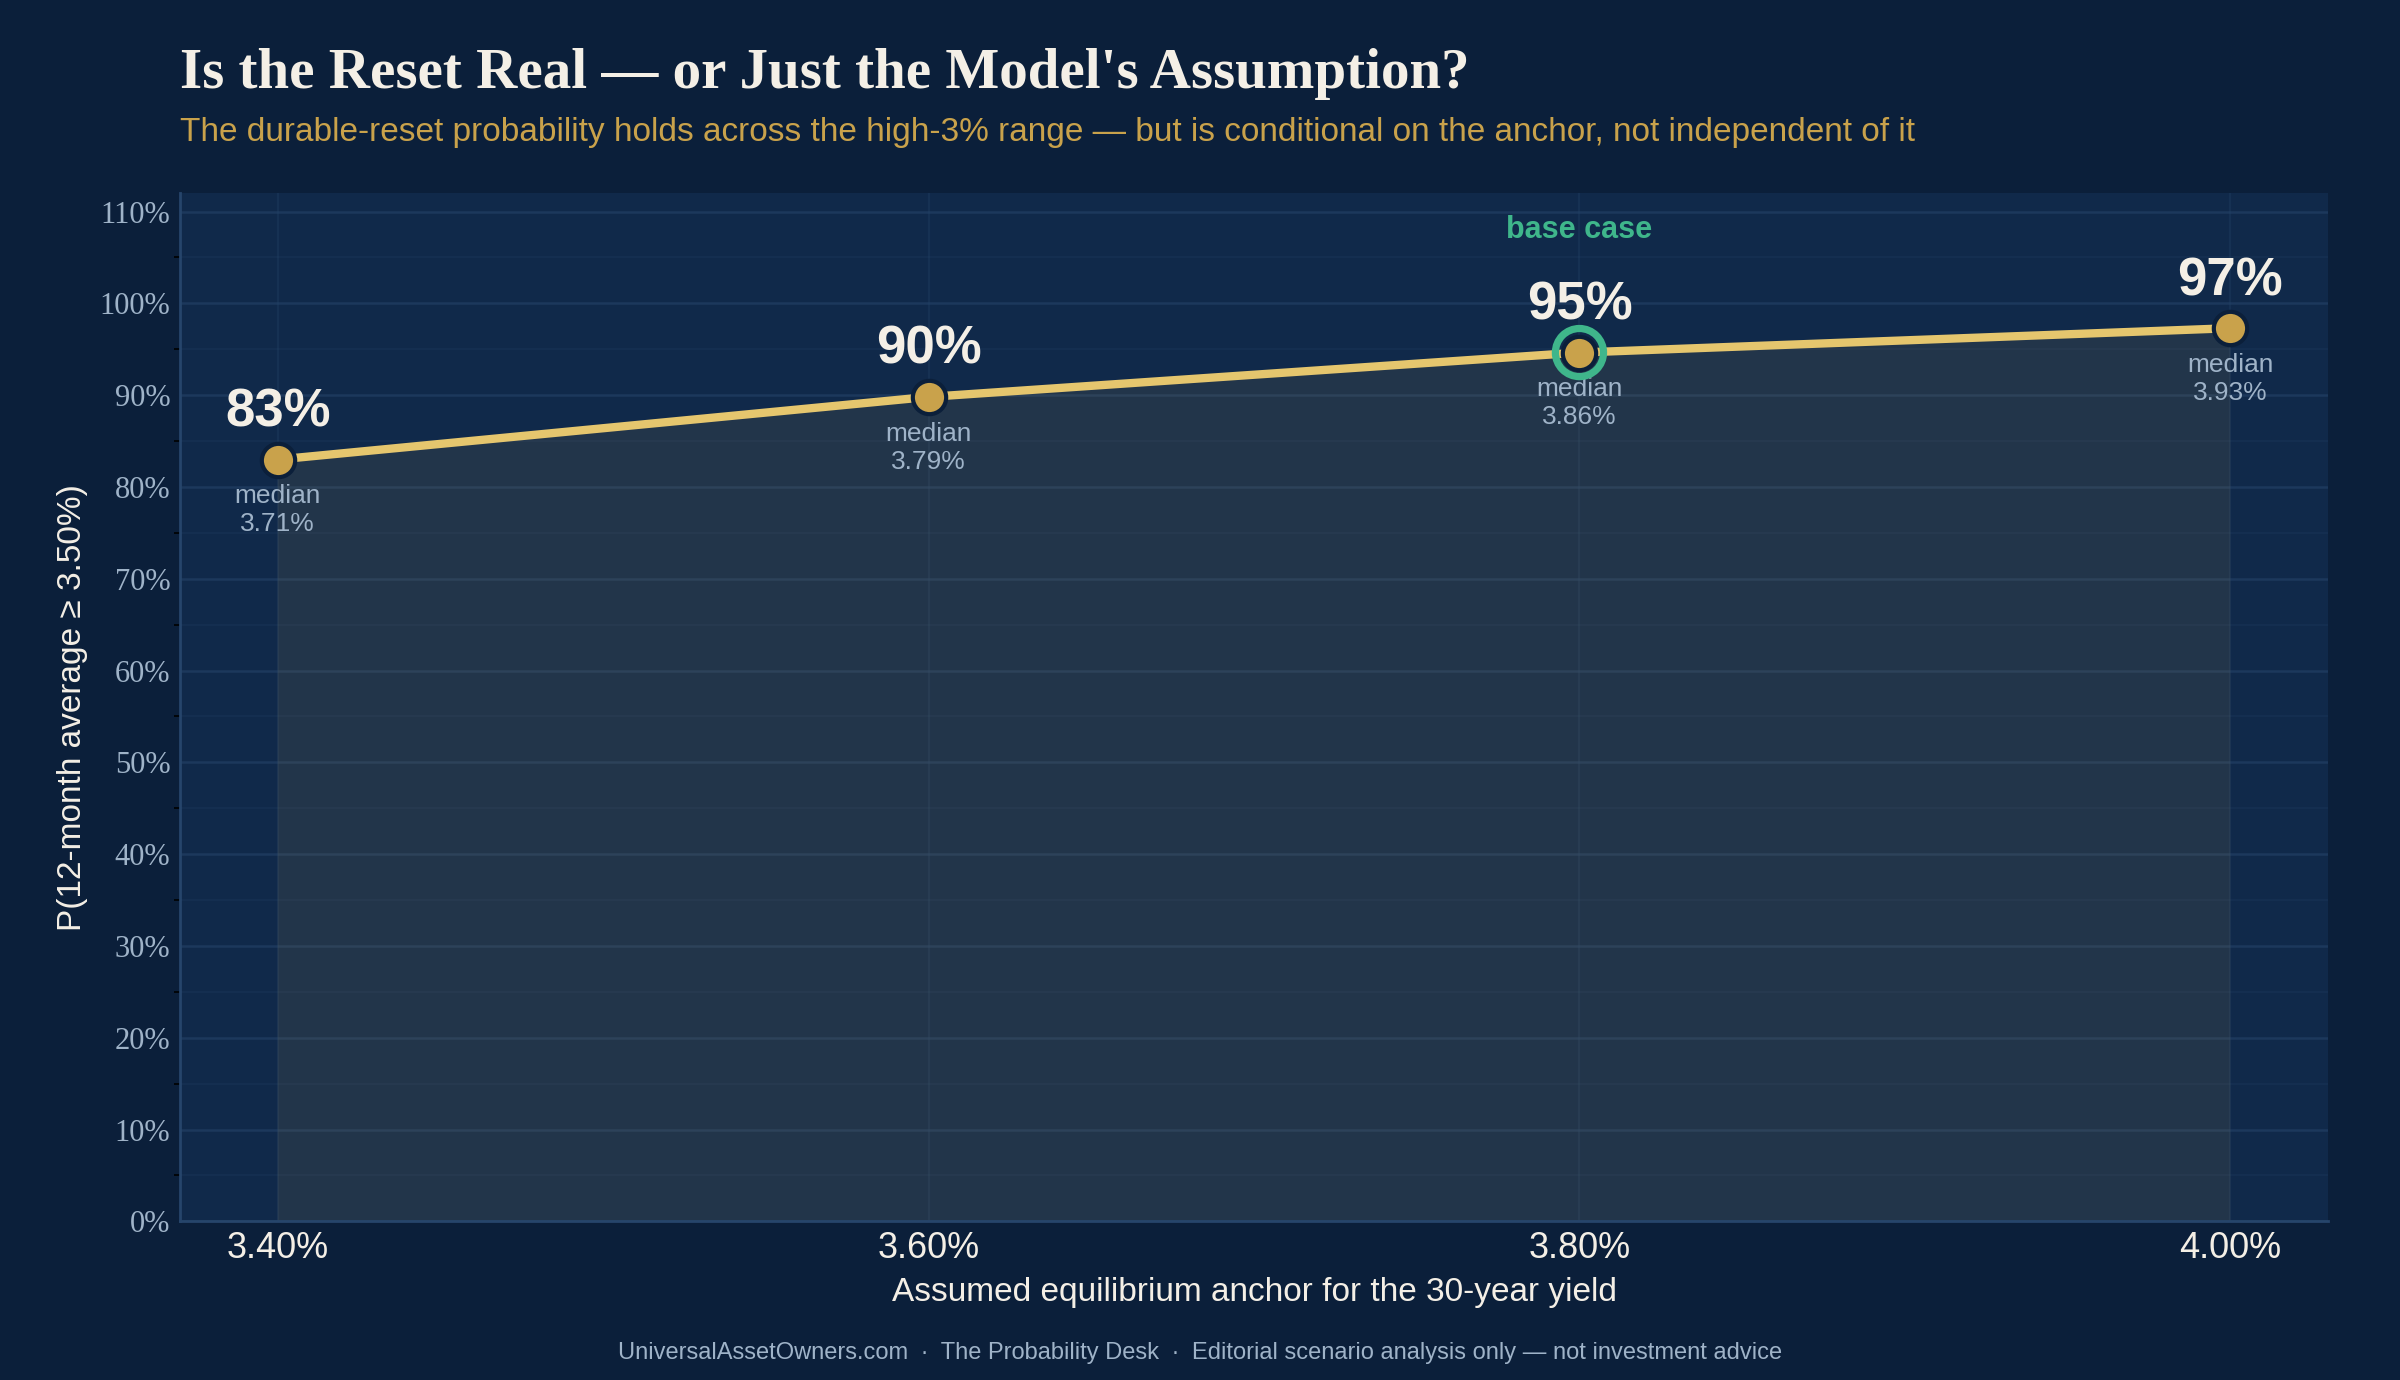
The durable-reset call is robust across the plausible high-3% anchor range but is not independent of it: even a 3.40% equilibrium — well below today’s spot — still leaves an 83% probability that the 12-month average clears 3.50%, because partial mean reversion over a single year keeps the early, higher months in the average. The call would only soften meaningfully if one believes Japan’s demographics and savings glut pull the true equilibrium back toward the low-3s or below.
Model-implied scenario mass (the simulation is input #3 of the ensemble): Upside 19% / Base 42% / Tail-A 28% / Tail-B 10%.
Limitations (stated plainly): this is a single-factor yield model; the jump parameters are judgmental, anchored to the January 2026 reference move; and the carry-unwind classifier is a reduced-form proxy on yield speed and level, not a full cross-asset contagion model. The model therefore under-states Tail-B — which is exactly why the published Tail-B (15%) sits above the model's 10%. We do not present this as "what the model says will happen"; we present it as one disciplined input, reconciled against base rates and expert priors.
Market vs Desk View
What the market is pricing: that Japanese rates are going higher — this is consensus and largely in the curve. The OIS path embeds further BOJ hikes; the super-long curve has steepened; the yen is weak at ~161.
What the Desk thinks is underpriced: the plumbing, not the direction. Three specific mispricings, in order of conviction:
- The repatriation bid is treated as gradual; it can be discontinuous. Japanese flow data show episodic selling of foreign debt, even as the simple stock of Japan's Treasury holdings rose into April. The market prices a slow, smooth drift; the August-2024 template says the flow can become a stampede when yen volatility spikes. The channel is intermittent today but convex. Highest-conviction mispricing.
- Cross-asset correlation in a yen-snap is underestimated. Yen-funded carry is diffuse — it sits behind US tech longs, EM local debt, and credit. A disorderly unwind correlates assets that screen as uncorrelated in calm markets. Tail-B is fatter than option markets imply.
- The orderly Upside is also underpriced. Symmetrically, consensus "JGB time bomb" framing may over-weight catastrophe; the BOJ owning half the market and the large domestic ownership base is a real circuit-breaker. The Desk's 20% Upside is above the doom-narrative's implied probability.
What would prove the Desk wrong: a sustained drop in the 30-year back below 3.40% with a stable yen would falsify the "durable reset" core; a large disorderly JGB move that produced no measurable global spillover would falsify the carry-unwind thesis.
Universal-Owner Portfolio Heatmap
Direction of reprice and magnitude band by asset class, across scenarios. For bond holders the effect is two-sided: a price effect today (existing holdings mark down as yields rise) and a reinvestment effect over time (new and maturing capital earns more). The arrows below show the net directional pressure on the asset class in each scenario (↑ = net favourable / yields move in owner's favour over the horizon; ↓ = net pressure; → = neutral). Strategic, not advice.
| Asset class | Base (Plateau) | Upside (Re-anchor) | Tail-A (Domestic spiral) | Tail-B (Carry-unwind) |
|---|---|---|---|---|
| JGBs (super-long) — price effect today | ↓ mild | → stabilise | ↓↓ large | ↓↓ then flight-bid |
| JGBs (super-long) — reinvestment over time | ↑ | → | ↑↑ | ↑↑ |
| Japanese equities (Nikkei) | → / ↑ (reflation) | ↑ orderly | ↓ (rate drag) | ↓↓ sharp |
| Yen (JPY) | ↑ gradual | ↑ orderly | ↑ | ↑↑ violent |
| US Treasuries (long) | ↓ mild (less Japan bid) | → | ↓ moderate | ↓↓ then ↑ flight |
| Global IG/HY credit | → | → | ↓ mild | ↓↓ spreads widen |
| Global equities (ex-Japan) | → | ↑ mild | ↓ mild | ↓↓ drawdown |
| EM local-currency debt/FX | → | ↑ | ↓ | ↓↓ outflows |
| Gold / reserves | ↑ | → | ↑ | ↑↑ haven bid |
| Global duration (term premium) | ↑ structurally | → | ↑↑ | ↑↑ repriced higher |
| Private credit / illiquids | → (lagged marks) | → | ↓ (funding cost) | ↓↓ (funding + marks) |
The structural takeaway for a universal owner: the single most durable line in this table is global duration / term premium ↑ structurally in every scenario but the Upside. The era in which the JGB suppressed the world's long-rate anchor is ending; long-dated discount rates across the book reset higher.
Second- & Third-Order Effects
The chain that matters runs outward from Tokyo. First order: higher JGB yields raise Japan's debt-service burden (already +10.8% in the FY26 budget, projected toward ¥40.3tn by FY29) and reprice ¥-denominated liabilities for life insurers under the J-ICS mark-to-market regime. Second order: Japanese institutions — among the world's largest pools of cross-border capital — find home assets attractive for the first time in a generation and have a growing incentive to repatriate, which would drain a structural bid from US Treasuries, European sovereigns, and Australian/EM duration over time. This channel is flow-sensitive and intermittent today — TIC data still show Japan as the largest foreign Treasury holder, with holdings rising into April — rather than a confirmed, sustained liquidation. Third order: the global term-premium floor rises; the discount rate on every long-dated asset (infrastructure, private equity, real estate, 30-year project finance) drifts up, compressing valuations that were underwritten in a sub-3% JGB world. A disorderly path adds a fourth order: a yen snap forces leveraged unwinds that correlate "diversified" books, and the very allocators who own everything discover they own one trade — short volatility, long carry — in many costumes.
Watch Dashboard
| # | Indicator | Threshold that moves the model | Implication |
|---|---|---|---|
| 1 | 30Y JGB 12-month running average | ≥3.90% = Tail-A lean; <3.70% = Upside | Core resolution variable |
| 2 | 30Y JGB intra-day level | >4.30% = spiral pressure; <3.40% = reset in doubt | Plateau vs spiral |
| 3 | 40Y JGB yield | re-test of ~4.2% Jan high | Super-long stress gauge |
| 4 | BOJ policy rate path | hike to ≥1.25% = faster than Base | Pace of normalisation |
| 5 | Super-long JGB auction tails / bid-to-cover | weak tail = Tail-A trigger | Demand at the long end |
| 6 | USD/JPY | sharp move toward 140 = carry-unwind underway | Tail-B trip-wire |
| 7 | Yen 1-month implied volatility | spike >12–14 | Carry-unwind speed |
| 8 | Japanese net foreign-bond flows (MoF weekly) + TIC country holdings (monthly) | sustained repatriation across both flow and stock | UST-bid drain (confirms vs. noise) |
| 9 | US 10Y/30Y term premium (NY Fed ACM) | step-up | Global spillover |
| 10 | Life-insurer JGB allocation guidance (semi-annual) | re-entry = Base; further cuts = Tail-A | Marginal domestic buyer |
| 11 | GPIF policy-asset-mix signals | tilt to JGBs = JGB backstop | Domestic absorption |
| 12 | VIX / global HY OAS | VIX>30, OAS>450bp = Tail-B confirmed | Cross-asset contagion |
| 13 | Nikkei drawdown | >10% with yen up = Tail-B | Equity transmission |
| 14 | Japan core CPI (ex-fresh food) | <2% sustained = Upside gate; >3% = hikes accelerate | Inflation driver |
| 15 | Takaichi fiscal headlines / supplementary budgets | new unfunded spend = Tail-A | Fiscal impulse |
Red-Team — How This Could Be Wrong
1. The "this time is different" trap on the carry trade. Richard Katz and others argue persuasively that the yen carry trade is smaller and better-hedged than the scare stories claim, and that August 2024 reversed precisely because the structural Japanese demand for foreign assets (pensions, lifers with foreign-currency liabilities) is sticky. If they are right, Tail-B is closer to 8% than 15%, and the Upside is larger. Falsifier: a large disorderly JGB move that produces no global spillover.
2. The BOJ blinks. Our Base and tails assume the BOJ keeps hiking. If growth rolls over or a global shock hits, the Board could pause or reverse — Ueda has been studiously data-dependent. That collapses the reset thesis itself. Falsifier: a BOJ pause with the 30-year back below 3.40% and a stable yen.
3. The model's anchor is an assumption, not a fact. We set θ drifting to 3.92%; as the sensitivity table shows, the headline probability is conditional on that choice. If the true equilibrium super-long yield is lower (Japan's demographics and savings glut reassert), the whole distribution shifts down and the durable-reset probability is overstated. The jump intensity is likewise judgmental. We have leaned against over-stating the tails in the model and corrected upward only with logged, sourced reasoning — but it remains the weakest assumption.
4. Fiscal credibility may be stronger than the periphery analogue implies. Japan borrows in yen, owns its own debt, and has a central bank holding half the market. The 2011 eurozone comparison may overstate Tail-A; debt-service fear may simply not detonate when the issuer controls the printing press. That would push Tail-A toward Base.
Methodology Box
Probabilities are the UAO Probability Desk's, weighted across three inputs by a written rule: base rate (0.4) — the historical frequency of durable sovereign-yield resets and disorderly carry unwinds (August 2024, 1994, eurozone 2011–12); expert priors (0.3) — dated, cited house and analyst views (State Street, R. Katz, AEI, BOJ communications); and a multi-agent / simulation input (0.3) — the 50,000-path jump-diffusion documented above. Estimates are normalised to 100% and rounded to 5% (we do not publish false precision). Where the published weight diverges from the raw model — here, Tail-B at 15% versus the model's 10% — the reason is logged (the model under-captures cross-asset contagion). Methodology available on request.
Disclaimer
This report is for informational and research purposes only and does not constitute investment, legal, tax, or financial advice. Editorial scenario analysis only — not investment, actuarial, or geopolitical advice. Probabilities are scenario weights, not guarantees; the Desk probability-weights, it does not predict.
Source Ledger
| # | Source | Date | Data point used | Conf. | Moves model? |
|---|---|---|---|---|---|
| 1 | Trading Economics — Japan 30Y bond yield | 2026-06-19 / 06-24 | 30Y JGB 3.84% (Jun 19), ~3.88% (Jun 24) | H | Yes (trigger) |
| 2 | CNBC — BOJ June decision | 2026-06-16 | Policy rate to ~1.0%, 7–1 vote, highest since 1995 | H | Yes |
| 3 | Trading Economics — Japan interest rate / 10Y | 2026-06-24 | BOJ rate ~1.0%; 10Y ~2.67% | H | Yes |
| 4 | Reuters — Himino remarks | 2026-06-19 | Deputy Gov signals continued hikes; inflation-overshoot risk | H | Yes |
| 5 | Reuters — BOJ June Summary of Opinions | 2026-06-24 | Some members called for further rate hikes | M-H | Yes |
| 6 | FinancialContent / market reporting — 40Y JGB | 2026-01 | 40Y breached ~4.2%, first since 2007 | M | Yes |
| 7 | CNBC — Takaichi snap election / fiscal | 2026-01-20 | 40Y first >4%; largest 30Y daily move since 1999 | M-H | Yes |
| 8 | CNBC — Takaichi extra budget | 2026-05-25 | ~$19bn supplementary package; issuance reassurance | M | Yes (Upside) |
| 9 | MOF / budget reporting | FY2026 | ¥122.3tn budget; debt-service +10.8% to ¥31.3tn at 3.0% | H | Yes (Tail-A) |
| 10 | Reuters — finance-ministry debt-service estimates | 2025-12 | Debt-service rising ¥31.3tn (FY26) → ¥40.3tn (FY29) | M-H | Yes (Tail-A) |
| 11 | IMF Global Debt Database | 2026 | Japan general-govt debt ~237% of GDP (GDD measure) | H | Context |
| 12 | IMF WEO / OECD | 2026 | Japan gross govt debt ~200–205% (alternative definitions) | H | Context (definition caveat) |
| 13 | Reuters — Japan net creditor ranking | 2026-05-25 | Japan slips to 3rd-largest net creditor; record net external assets ¥561.75tn | H | Yes (corrects prior claim) |
| 14 | U.S. Treasury TIC — major foreign holders | 2025-12 / 2026-03 / 04 | Japan UST holdings $1.1855T → $1.1916T → $1.2099T; largest foreign holder | H | Yes (Tail-B caveat) |
| 15 | Reuters — April TIC flows | 2026-06-18 | Foreigners bought $103bn US securities; Japan UST holdings rose | M-H | Yes (Tail-B caveat) |
| 16 | Insurance Business — midsize lifers cut super-longs | 2026 (Q2) | Fukoku et al. stepping back from 30/40Y | M | Yes |
| 17 | Nikkei Asia — life insurers cut JGB holdings | FY2025 | Top lifers cutting ¥1.3tn ($9.1bn) | M | Yes |
| 18 | Aviva Investors — "Bond Voyage," lifers & J-ICS | 2026-02 | J-ICS marks assets+liabilities at market | M | Yes |
| 19 | Bloomberg — GPIF portfolio-shift speculation | 2026-01-27 | $1.8tn GPIF could tilt to JGBs / cut foreign bonds | L-M | Partial |
| 20 | FRED DEXJPUS / Reuters | 2026-06-24 | USD/JPY ~161; intervention watch | H | Yes |
| 21 | AEI — "Beware the unwinding carry trade" | 2026 | Carry-unwind risk case | M | Yes (Tail-B) |
| 22 | R. Katz (Substack) — "don't buy scare stories about JGBs" | 2026-02-06 | Counter-view: unwind overstated | M | Yes (Upside) |
| 23 | State Street — Japanese super-long weakness | 2026 | "Not sounding the alarm bells yet" | M | Yes (Upside) |
| 24 | CNBC — BOJ Dec 2025 hike | 2025-12-19 | 10Y JGB past 2%, first in two decades | H | Context |
| 25 | Wright Research — Japan bond-market analysis | 2026 | Carry trade ~$350–500bn notional (estimate) | L-M | Context |
| 26 | UAO Probability Desk simulation (fixed seed 20260622) | 2026-06-22 | 50k-path jump-diffusion outputs + anchor sensitivity | H | Yes (input #3) |
Confidence: H/M/L. Figures dated; news-lead claims current as of June 24, 2026. The source ledger reflects the Desk's best available public-source verification as of publication; corrections and updates will be logged.
Continue the briefing. Read the daily brief · watch the daily video briefing · listen to The Universal Owner · view the chart of the day.
Produced and edited by the UAO editorial desk. Not investment advice.