
The Probability Desk — Japan's 30-year anchor: how high, how fast?
UAO scenario model: 55% probability the 30-year JGB averages ≥ 4.00% over the next 12 months
UAO Probability Desk · June 25, 2026 · Monte Carlo, 50,000 paths (seed 20260625)
The question that matters
Today's lead — the end of cheap global money — rests on a single forward question: not whether Japan's long bond has repriced (it has, to near 3.9% on June 24), but how much further it runs, and how fast. Because Japan's 30-year bond is one of the last major anchors of cheap long-duration capital, its path matters far beyond Tokyo — it feeds the global term premium and, with it, the discount rate on long-dated assets. So the Desk modelled it directly.
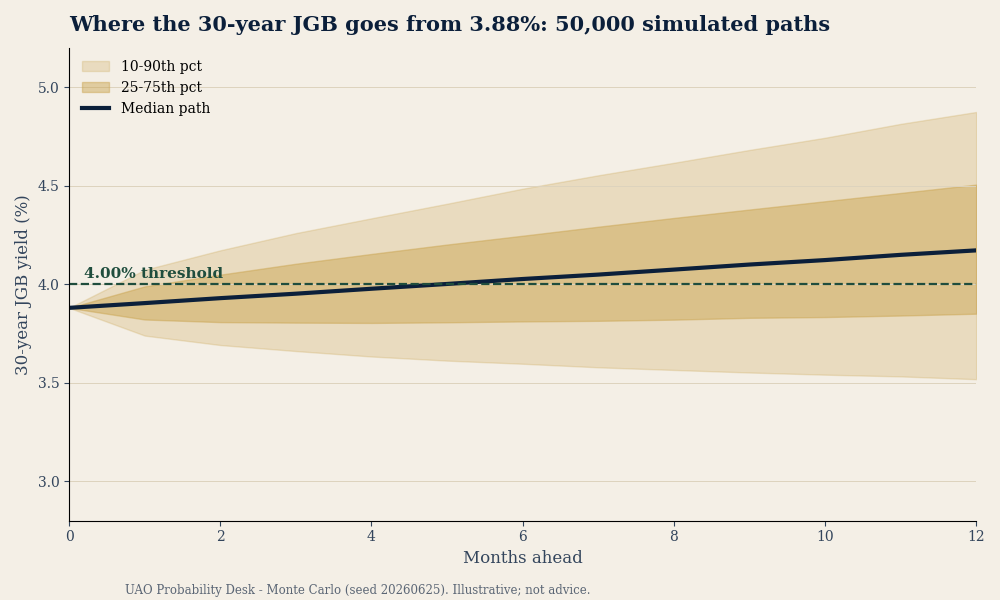
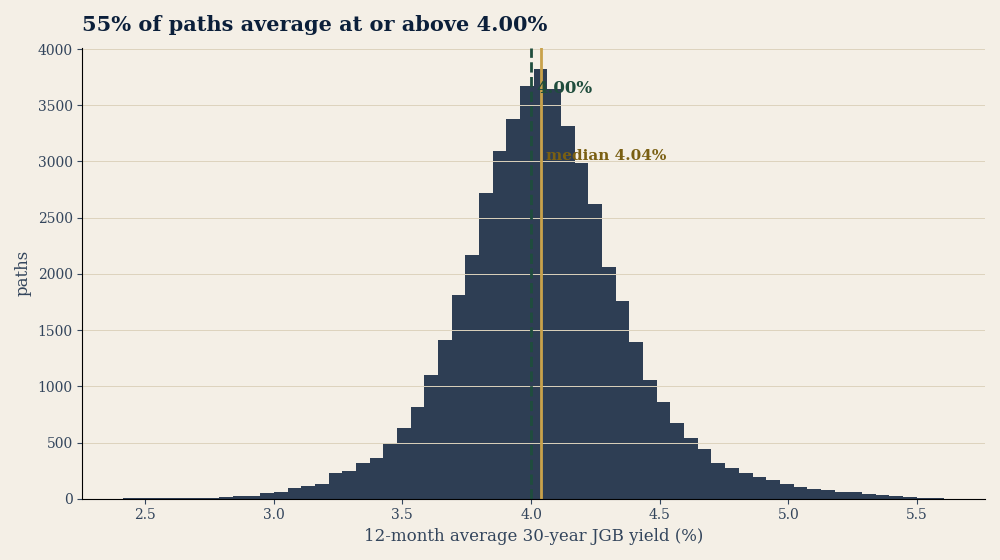
Headline result: our 50,000-path scenario model assigns a 55% probability that the 30-year JGB averages at or above 4.00% over the next twelve months, with a median average of 4.04% and a median end-point of 4.17%. The model puts the probability it touches 4.25% at some point in the year at 54%; touching 4.50% at 31%; and the probability the yield ends the year back below 3.50% at 9.5%. This is not a market-implied forecast — it is the Desk's judgment-weighted distribution around a regime shift in Japanese rates.
How the model is built
We simulate 50,000 twelve-month monthly paths for the 30-year JGB from a starting level of 3.88% (the June 24 reference; sources differ by a few basis points — see Honest limits), under four regimes whose weights reflect the Desk's read of the policy and flow backdrop:
| Regime | Weight | Monthly drift | Monthly vol | Narrative |
|---|---|---|---|---|
| Base — orderly regime change | 50% | +0.020pp | 0.10pp | BoJ continues a measured exit; term premium grinds higher |
| Upside — faster normalisation | 22% | +0.045pp | 0.13pp | Sticky inflation / wage momentum pulls hikes forward |
| Tail-A — disorderly overshoot | 13% | +0.075pp | 0.22pp | Carry unwind + supply indigestion; yields gap |
| Tail-B — BoJ stalls / global risk-off | 15% | −0.025pp | 0.16pp | Growth scare or global shock pulls JGBs back down |
Method note: each path is assigned one regime for the full 12-month horizon; monthly changes are drawn from a normal distribution using that regime's drift and volatility; yields are clipped to a 1.5%–6.0% corridor after each monthly step; the 12-month average is calculated across the 12 simulated monthly observations.
Why these weights: they are judgmental, but anchored to the BoJ's stated tightening bias, current long-yield levels, the recent pace of the move (~+1.2pp over the past year), and the offsetting risk that political pressure or a global risk-off could stall the path. We keep a meaningful 15% on a lower path (Tail-B) because Japan's own growth blueprint urges the BoJ to support private demand, even as some BoJ members argue for faster hikes — so the distribution is deliberately two-sided, not a one-way bet.
What the distribution says
The fan chart shows the median path crossing 4.00% within the first half of the year and the 75th percentile pushing toward 4.6% by month twelve; the 10th percentile drifts sideways near 3.6%. The histogram of twelve-month average yields clusters at 4.0–4.1% with a right tail extending past 4.5%. In plain terms: under these assumptions, the most likely outcome is not a return to cheap Japanese funding but a year spent at or above 4% — a level Japan has not sustained since the 1990s.
Why it matters to a universal owner
A higher, durable JGB does three things at once, and each cuts across diversified portfolios rather than sitting neatly inside one asset-class sleeve: 1. It lifts the global term premium. Long-dated cash flows — infrastructure, private equity, 30-year liabilities — are discounted at a higher rate. A move from a sub-1% to a roughly 4% long-rate anchor in one of the world's largest creditor economies is a structural re-rating of duration. 2. It withdraws carry funding. The yen-funded trades that quietly levered global risk become costlier to run as the curve steepens; the unwind is the mechanism behind today's "Liquidity Turn" scenario. 3. It repatriates capital. Japanese institutions that reached abroad for yield have less reason to. The marginal bid for long-dated Treasuries and global credit thins.
The owner's playbook
- Re-discount the long book. Re-run private-market and liability valuations at a higher term premium; the 55%/4.00% result is a reasonable internal scenario to stress against — not a market-implied forecast — with 4.25–4.50% as the tail.
- Map carry leverage. Identify every position whose return assumed cheap, p