This week, Bank of America's June fund-manager survey called “long global semiconductors” the most crowded trade in the survey's history — 80% of managers, up from 73% in May, with the next-most-crowded trade a distant 12%. The AI bubble is now the second-biggest tail risk they name.
That is the same theme the world's sovereigns spent 2025 concentrating into. When the market's most crowded trade, the largest sovereign cheques, and a fund's own private-infrastructure book all point at the same square foot of silicon, the question is no longer whether AI is attractive — it is whether you own the same bet several times over.
The Balance Sheet of the Buildout
Our flagship daily research note. Who actually funds the $6.7tn AI-infrastructure wall — and why the financing structure is engineered to hide the risk from the universal owner. A ~5-minute read for CIOs, CROs and trustees.
The illusion of diversification
McKinsey projects roughly $6.7tn of global data-center capex by 2030; BlackRock models a $5tn–$8tn AI-infrastructure wall this decade. The useful question for an allocator is narrower: whose balance sheet actually absorbs it? Hyperscalers can fund the silicon from cash flow — but not the power, land, grid and cooling underneath. That gap is filled by private capital, and specifically by the largest, most patient owners in the world.
The off-balance-sheet daisy chain
The buildout is increasingly financed through special-purpose vehicles: a thin slice of equity, a large tranche of GPU-backed debt, and a lease back to the hyperscaler — with the debt kept off the tech company's balance sheet. Oracle, Meta, xAI and CoreWeave have moved roughly $120bn of AI-infrastructure debt off balance sheet this way. The trick works for everyone except the universal owner, which can end up holding the SPV equity (first loss), funding the debt through its private-credit sleeve, owning the hyperscaler tenant in public equities, and holding Nvidia — which has committed up to $100bn to OpenAI (part of a $110bn round) in a circular-financing pattern. Four “diversified” sleeves; one daisy-chained bet on the same silicon. The hedges are the bet.
The hidden variable: depreciation
The “safe” contracted cash flows rely on the tenant's ability to pay — flattered by an aggressive accounting assumption. A GPU's frontier life is two to three years, yet Microsoft, Alphabet and Meta have stretched server useful lives toward five to six. Amazon already flinched: in February 2025 it reversed its server life from six years back to five, taking a ~$700m hit to operating income and a $920m accelerated-depreciation charge. A 15-year data-center lease is implicitly underwriting a six-year depreciation assumption on hardware that may be obsolete in three.
The divergence as a signal
While sovereigns surged in, pensions pulled back (deal value −5.46% to $74.31bn). That is a liquidity-premium transfer: sovereigns, with no near-term call on cash, are paid to provide the patience pensions cannot. If pensions re-enter late in 2026, they arrive as the marginal, liquidity-constrained buyer — historically one of the more reliable signals of a top.
Can we produce a single look-through number for AI-linked exposure across public equities, private infrastructure, real estate, power, credit, venture and external managers? If not, the portfolio does not yet know how much of the buildout it owns — or how many times it owns the same risk.
The winners will not ask, “Do we own AI?” They will ask, “Where do we own it, how many times, and who holds the residual risk if the buildout disappoints?”
Sources: McKinsey; BlackRock; S&P Global Market Intelligence; State Street; Bloomberg; Tunguz; Amazon 10-K; Goldman Sachs; UN University; CPP Investments.
1. The most crowded trade in history is now “long semiconductors.”
BofA's June survey: 80% of managers call long global semiconductors the most crowded trade in the survey's history, up from 73% in May; long the “Magnificent 7” is a distant 12%. Allocators trimmed net equity overweight to 38% from 50%, and named the AI bubble their #2 tail risk. Read the survey →
2. Who is funding the crowd: sovereigns wrote the biggest cheques.
Across 2025, S&P Global Market Intelligence data show SWF-backed transaction value of $199.9bn (up 198.4%), $126.23bn in TMT, vs pension-backed $74.31bn. Sovereign private-market exposure has risen from ~25% (2020) to ~30%. Open the data →
3. Divergent central banks, an easing long end.
10-year Treasury 4.38%, Brent near $72. The Fed held at 3.50–3.75%, the ECB raised to 2.25%, the BoJ sits at 1% (highest since 1995). Underwrite to a 10-year back above 4.75% — not today's rate.
4. The binding constraint is power.
U.S. data-center power demand is forecast to more than double, 31 GW (2025) to 66 GW (2027) (Goldman Sachs). Underwrite data centers as integrated energy and counterparty-risk assets — power, grid queue, water and curtailment risk.
The most crowded trade in market history is now “long semiconductors.”
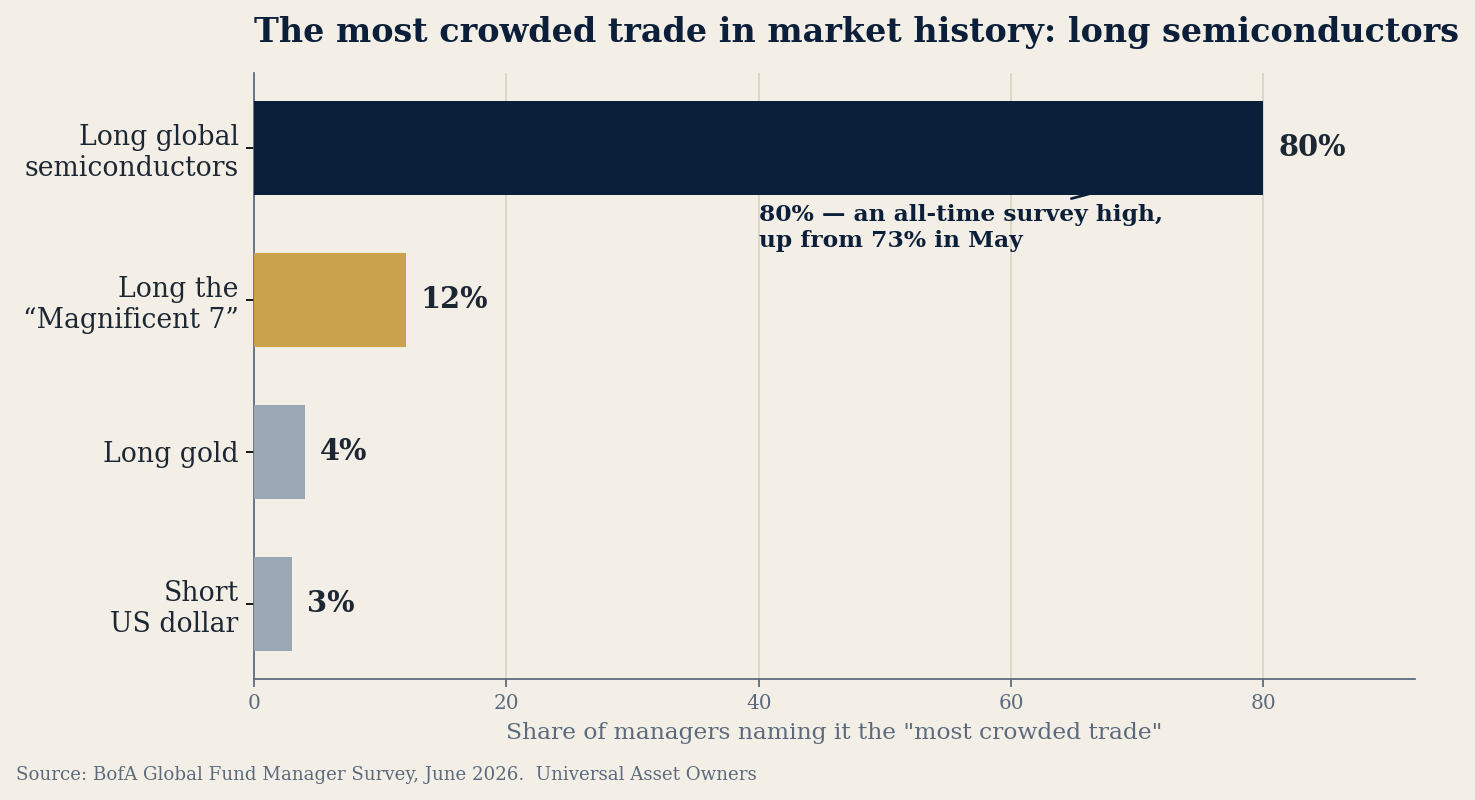
Source: BofA Global Fund Manager Survey, June 2026. UAO Research.
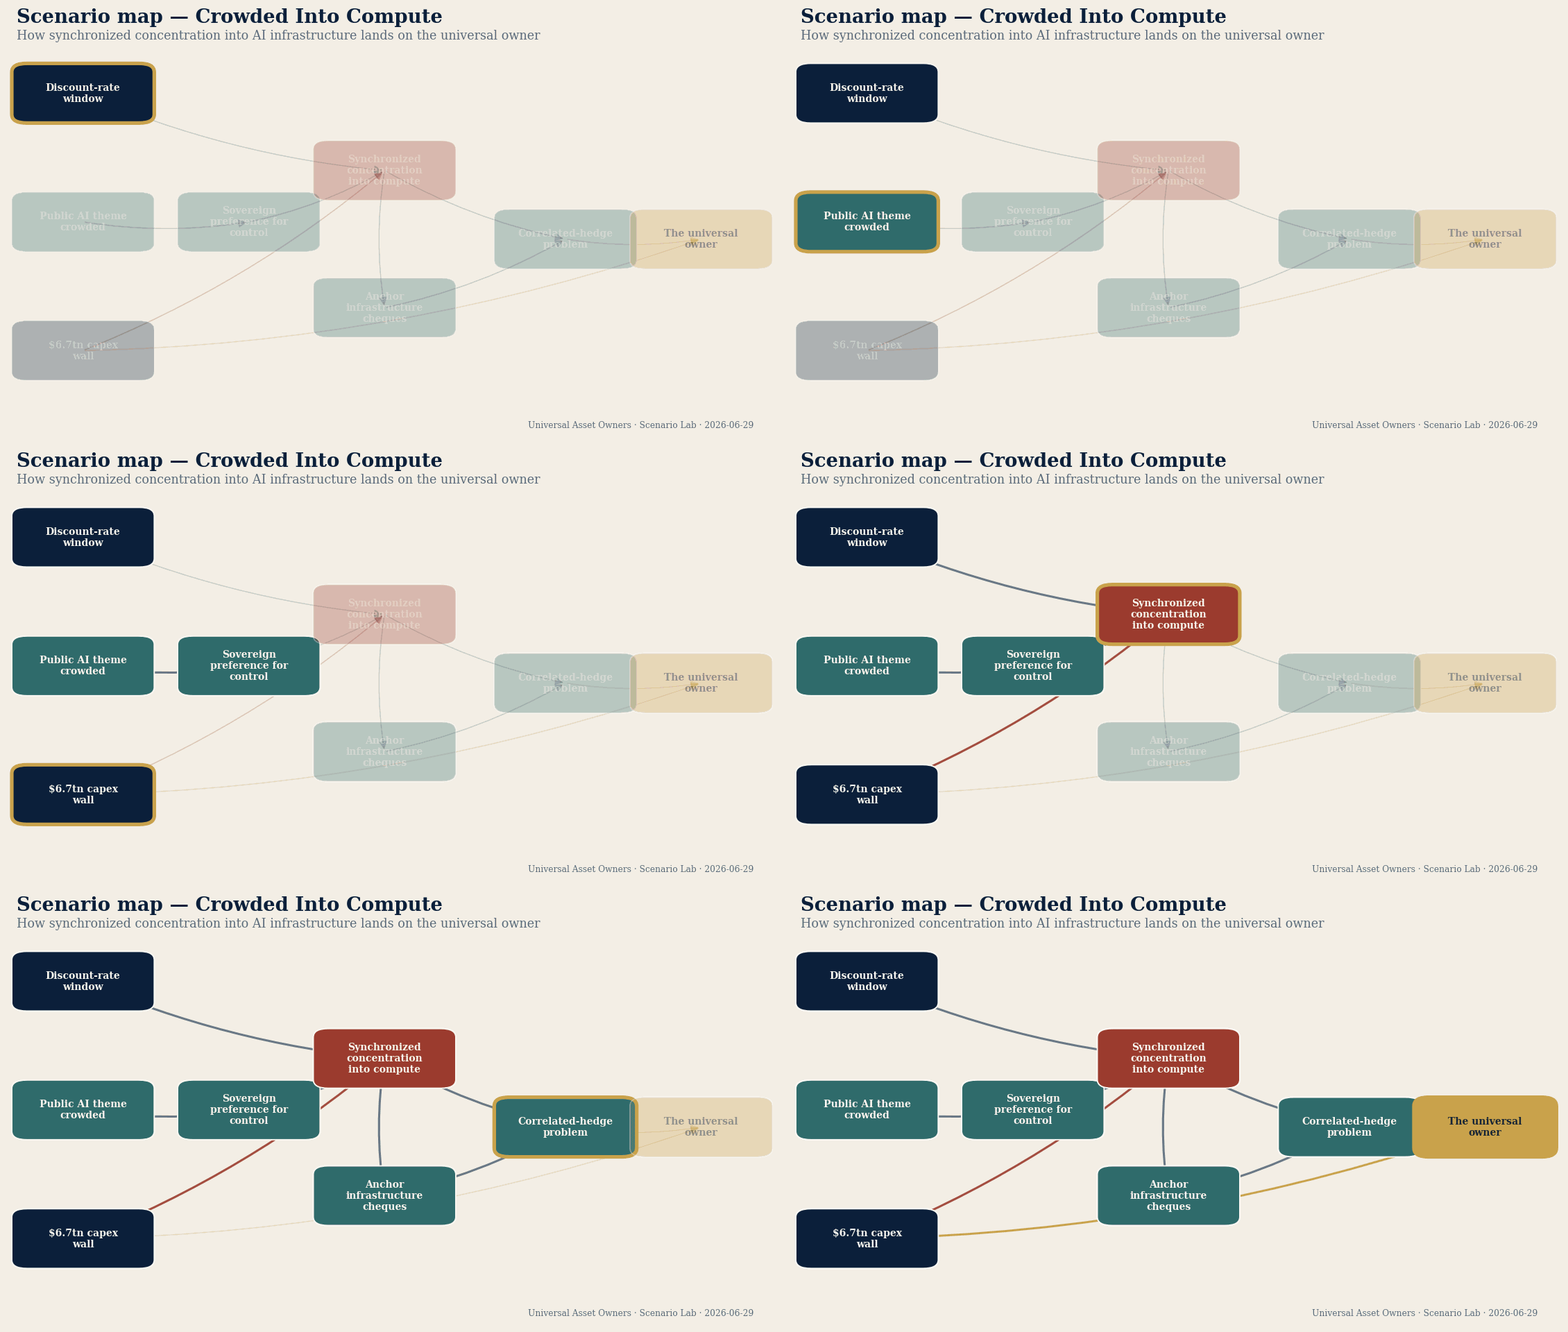
Click any player — a pension CIO, a chief risk officer, an infrastructure lead — and ask our desk what they do next. Judgment-weighted probability; 12–24 month horizon.
| Open the live scenario → |
| Apple Podcasts | Spotify |
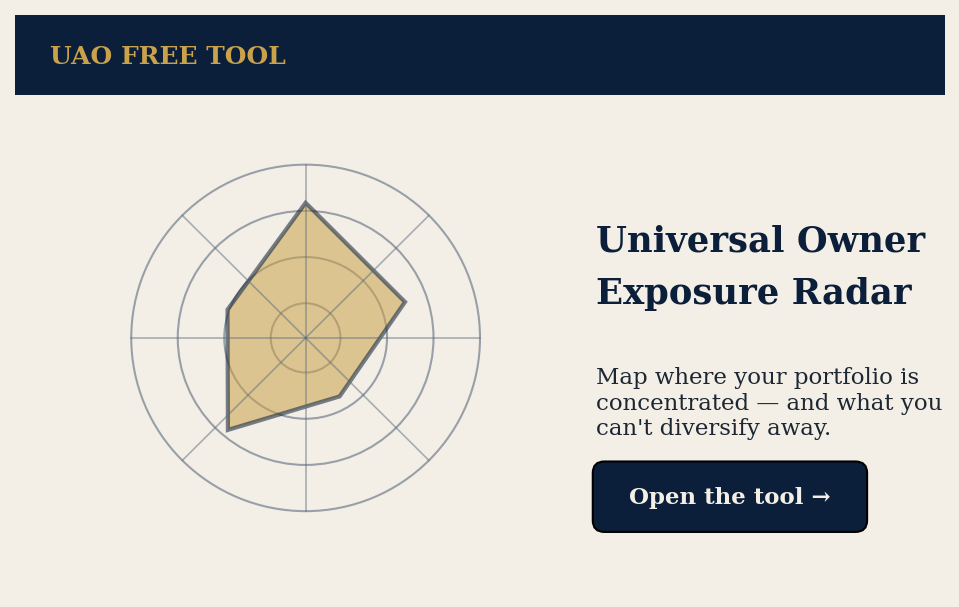
A free, interactive tool that maps your portfolio's look-through exposure to a single theme — public equities, private infrastructure, power and credit — on one radar, so you can see how concentrated you really are before the market reprices it.
| Open the Exposure Radar → |