
US markets are closed for Juneteenth. The week that ends here began with a Fed silence and ends with a structural question no long-horizon allocator can defer: while hyperscalers commit $700 billion to AI infrastructure this year, the power grid that must serve it is four to seven years behind. Listed infrastructure — the direct proxy for that constraint — is trading at valuations last seen in the Global Financial Crisis. Below: why that gap is the story of the decade for universal owners, how Asia's sovereign capital is repositioning its $7.5 trillion in US-denominated exposure, and what the private credit split between institutional and retail tells you about where the smart money is reading the cycle. Also today: an Allocator Insight from Antoine Tigneres — sourced to Alphabet's 10-K, the IEA, and Ireland's electricity data — on who owns the bottleneck and what operator alpha looks like from here.
— Three links worth your time —
IEA — Electricity 2025: Data centres and AI driving the sharpest demand surge in decades. The International Energy Agency's authoritative account of where AI infrastructure spend is going and why the power constraint is the binding factor for the decade ahead.
BloombergNEF — Global data centre energy demand to nearly double by 2030. The demand forecast that anchors the scenario. The gap between projected load and available interconnected grid capacity is the entire investment thesis.
UAO Newsroom — The AI Power Grab: Why the Next Sovereign AI Trade Is Power, Not Models. Antoine Tigneres on owning bottlenecks rather than narratives — with Alphabet 10-K capex data, the IEA demand forecast, Ireland's electricity stress test, and Meritech's software multiples. The investment allocation companion to today's lead.
UAO Daily Brief. Researched and edited by the UAO editorial desk. Not investment advice. info@universalassetowners.com
Today's Intelligence
Top Stories
Three stories driving long-horizon capital decisions — selected by the UAO editorial desk.
1. The AI Power Grid Crunch — and why listed infrastructure is mispriced.
The hyperscalers have committed to spending approximately $700 billion on AI infrastructure in 2026 — five times the level of five years ago. Every dollar of that capital makes the same demand: reliable, grid-scale power delivered to data centres within permitting timelines that haven't moved in forty years. The Lawrence Berkeley National Laboratory now projects US data centre electricity demand at 74 gigawatts by 2028. The problem is that only around 25 gigawatts of that is covered by currently permitted, interconnected capacity. The gap is 49 gigawatts — and it is not closing.
This is not primarily a generation problem. The US has sufficient generation capacity in planning. It is a permitting problem, an interconnection queue problem, and a transmission problem. Regional transmission operators now report average interconnection queue backlogs of four to five years — meaning power generation approved today does not reach the grid until 2030 at the earliest. The permitting process for new high-voltage transmission lines runs from six to twelve years in most US jurisdictions. The AI buildout operates on a two-year deployment cycle. The mismatch is structural.
The market has priced the AI capex story extensively — hyperscaler equities, semiconductor supply chains, and data centre REITs have all repriced substantially. What it has not done is connect that story to the infrastructure that must serve it. Listed infrastructure equities — the power generators, grid operators, and transmission companies that are the binding constraint on the entire AI buildout — are trading at EV/EBITDA multiples not seen since the 2009 Global Financial Crisis. Private infrastructure funds are pricing equivalent exposure at roughly three times listed market valuations. The same asset, priced three times higher in private markets than public markets, is a market structure observation that demands an explanation.
The explanation is institutional: most large allocators built their infrastructure exposure through private funds over the past fifteen years, when the illiquidity premium was real and private managers could source deals that listed markets couldn't access. That dynamic has now partly reversed. The AI power demand story is so large and so well-telegraphed that the listed infrastructure universe — which trades daily and requires no lockup — is a direct, liquid proxy for it. Yet allocators with mandates weighted to private infrastructure have limited appetite to add listed exposure because it shows up differently on the allocation sheet.
For a universal owner with a 20-to-30-year horizon, the question is straightforward: if the power grid is the binding constraint on the most consequential technology buildout in history, and the listed equity proxy for that constraint is at GFC-era multiples, is that a value entry or a value trap? The answer turns on one variable: whether permitting reform in the US accelerates the 49 GW gap closure before the AI capex cycle peaks. If it does, listed infrastructure re-rates sharply. If it doesn't, the AI buildout slows — and hyperscaler capex disappoints. Either path reprices infrastructure.
Sources: CNBC — Big Tech AI capex tracking $700B, April 2026 · Lawrence Berkeley National Laboratory, US Data Centre Energy Use Report · Morgan Stanley Infrastructure Research, 2026 · EU Clean Energy Investment Strategy, March 2026.
2. Asia's $7.5 trillion pivot — how sovereign capital is reducing US exposure.
Asian central banks and sovereign wealth funds collectively hold approximately $7.5 trillion in US-denominated assets — primarily Treasuries and agency debt. The question of how, and at what pace, that exposure gets reduced is the most consequential slow-moving capital flow story of the decade. The answer arriving in 2026 is: carefully, through diversification rather than liquidation, and into three destinations — European sovereign debt, regional infrastructure, and alternative reserve assets including gold.
The shift is being driven by a combination of factors that have converged this year: the Warsh Fed's removal of forward guidance (raising duration uncertainty for the largest fixed-income book on earth), the broadening of US fiscal deficits to levels that pressure long-run dollar credibility, and a structural push within Asia to develop regional capital markets that reduce dependence on New York and London settlement infrastructure. China's PBOC, Japan's GPIF, and the ASEAN sovereign funds are each moving along this path at different speeds — but the direction is consistent.
The market implication for universal owners outside Asia is that the historically reliable bid for long-dated US Treasuries — which smoothed duration markets for a generation — is becoming less reliable at the margin. This does not mean a disorderly exit; it means a gradual structural shift in who absorbs US debt issuance and at what yield. For allocators managing long-duration liabilities against a discount rate anchored to US Treasuries, that is a regime change worth pricing.
Sources: IMF COFER data, Q1 2026 · Bank for International Settlements, Cross-border Exposures · PortWatch Asia sovereign capital flows monitor.
3. Private credit splits — retail pulls back as institutions hold.
Private credit has bifurcated. Institutional allocators — pension funds, insurers, endowments — are holding or adding to their private credit positions. Retail and semi-institutional vehicles — BDCs, interval funds, and retail credit structures that expanded rapidly from 2022 to 2024 — are seeing net outflows for the second consecutive quarter. The divergence tells a story about which cohort actually understood the liquidity terms they signed up for.
The risk for institutional allocators is not direct contagion — their structures are locked, their terms are different, and their counterparty set is largely non-overlapping with retail vehicles. The risk is indirect: as retail flows slow, some direct lenders who built platforms on the back of retail capital will need to reduce deployment, tightening credit availability at the margin and widening spreads in middle-market lending. That is an opportunity for the well-capitalised institutional lender with dry powder, and a headwind for the platform that needs continuous inflows to fund its pipeline.
The broader read-across: private credit is maturing as an asset class. The divergence is a sorting mechanism, not a crisis. Watching which platforms survive the retail outflow phase will separate the durable managers from the cycle beneficiaries.
Sources: Preqin Private Credit Monitor, Q2 2026 · Aviva Investors Private Markets Study 2026 · LCD / PitchBook direct lending data.
— Capital briefing —
GCC sovereign deployment — $26 billion in Q2. Gulf Cooperation Council sovereign wealth funds deployed an estimated $26 billion in Q2 2026, with the bulk directed to infrastructure, private equity, and real assets in North America and Europe. Technology and AI-adjacent infrastructure are emerging as the highest-growth allocation category for the Gulf SWFs this year.
Canada's proposed sovereign vehicle. Discussion of a federal Canadian sovereign wealth-style vehicle — structured around the Canada Growth Fund and expanded infrastructure mandates — has moved from think-tank territory into active policy dialogue in Ottawa. If enacted, it would represent the first explicit federal sovereign capital vehicle in North America.
Source: Lawrence Berkeley National Laboratory · Morgan Stanley Infrastructure Research · UAO Research desk.
"The AI infrastructure story has been told entirely in the language of the companies building it — chips, software, data centres, valuations. The language it hasn't been told in yet is power. A 49-gigawatt shortfall against a four-to-seven-year permitting clock, backed by $700 billion in committed annual capex, is the largest mismatch between capital demand and physical infrastructure the modern economy has produced. Listed infrastructure is sitting at the intersection of that gap at 2009 prices. That is the sentence a universal owner needs to explain to their investment committee today."
|
Free Tool of the Day · 4 of 12
Allocator Peer-Positioning Benchmark
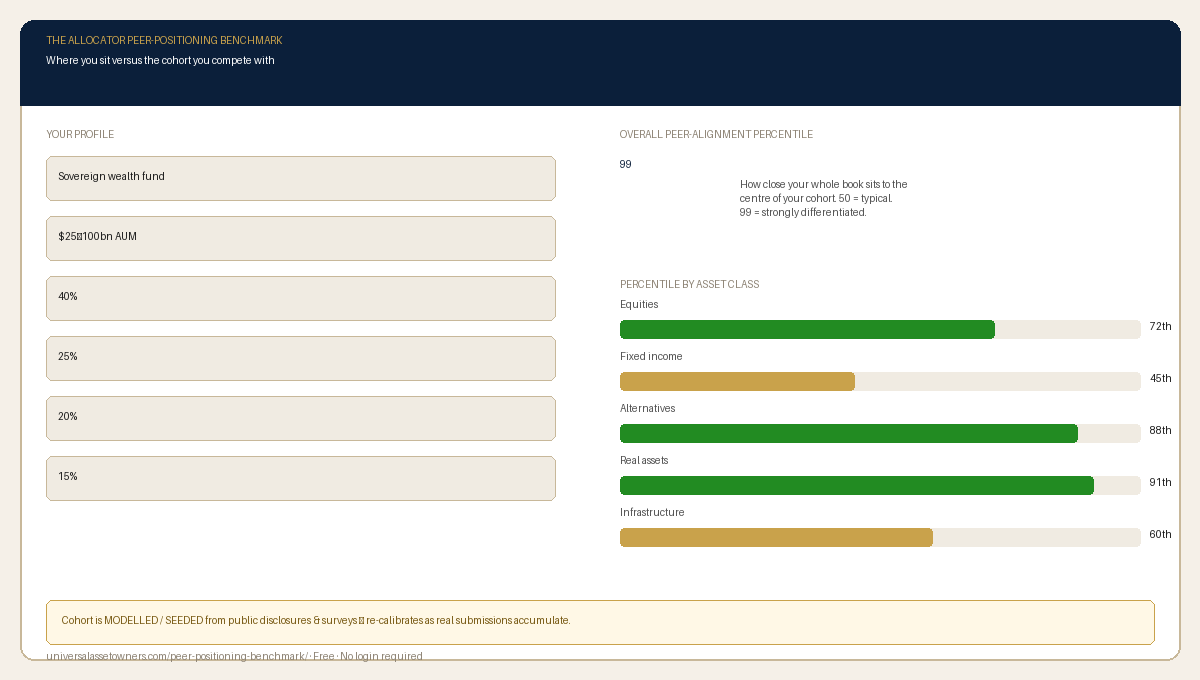
Where you sit versus the cohort you compete with. Tap to run it live →
Markets are closed today for Juneteenth. That makes it a good day to look at your own positioning. The Peer-Positioning Benchmark maps your current asset allocation against the actual published weights of sovereign wealth funds, large public pensions and endowments that you share the index with. It uses the latest disclosed allocations from CPP, NBIM, Ontario Teachers’, GIC, ADIA, and seventeen other major universal owners to show you the percentile distribution in every asset class — and where the smart money has been moving since rates peaked.
Weights sourced from publicly disclosed annual reports and regulatory filings. Free, no login to explore. Data updated quarterly.
Check the benchmark →
|
|
From the Newsroom
Hyperscalers are committing $700 billion to AI infrastructure in 2026 — but every dollar demands power that the grid cannot yet supply. Antoine Tigneres maps the 49-gigawatt gap between projected AI demand and permitted interconnection capacity, explains why listed infrastructure equities trade at 2009 valuations while private funds price equivalent exposure at 3× listed, and asks whether that dislocation is a structural mispricing or a liquidity discount worth holding. Essential context for any universal owner with an infrastructure allocation.
Read the full analysis →
|

Research and editorial for the world's largest long-term investors.
universalassetowners.com · Unsubscribe · View in browser