Volume 1, Issue 36 · Tuesday, June 16, 2026 · 7:00 am ET / 15:00 GST
Kevin Warsh's first rate decision lands tomorrow at 2 p.m., and the gap between what the Fed will signal and what the market believes is the real trade. Below: the easing-bias question the dot plot answers in 24 hours, an oil price that has round-tripped to $80 and is quietly unwinding the inflation the Fed is reacting to, the moment sovereign capital became the marginal buyer of private assets, and the largest US pension switching to a new operating system on July 1. One chart, one take, and three links worth your time.
1. Warsh's first dot plot lands tomorrow — and the market is betting against it.
The Federal Open Market Committee meets today and Wednesday, the first under Chair Kevin Warsh, who was sworn in May 22. Markets price roughly a 97–99% probability of a hold at 3.50–3.75%, so the rate is not the story. The story is the bias: officials have signalled the committee may drop the easing language it has carried all year, now that headline CPI sits at 4.2%. Warsh's first Summary of Economic Projections — the dot plot — and his debut press conference are the actual release.
Here is the tension a universal owner has to price. The market-implied path still runs faster than the Fed's own dots: the two-year Treasury yields about 4.05% and the ten-year about 4.46%, levels that embed cuts the SEP has not promised. Investors are effectively betting that incoming data — above all, a collapsing oil price — will force the Fed to ease more than it is willing to say tomorrow. If Warsh removes the bias and the dots show no 2026 cuts, that bet gets repriced at the front end, along with every long-duration book that has leaned on the easing put.
Source: FXStreet, June 15, 2026. | CME FedWatch / Reuters poll, June 2026. | Coverage: Macro, this week.
2. Oil's round-trip is the disinflation the Fed can't yet see.
WTI traded around $80.47 and Brent around $83.32 on Tuesday as the US–Iran agreement to wind down the conflict and reopen the Strait of Hormuz held into the week. Brent peaked above $113 in March; the supply shock that drove the energy spike behind May's 4.2% print is unwinding in real time.
That is awkward for a committee setting policy on lagging data. If half the energy contribution to the inflation print is gone by July, the inflation Warsh answers for tomorrow is not the inflation he faces next quarter. For an owner of the whole economy the read-across cuts both ways: cheaper energy eases the headline and supports the consumer, but it also pulls the rug from the very commodity and real-asset hedges that worked while the shock was live. The hedge and the risk turned out to be the same position.
Source: Trading Economics, crude oil, June 16, 2026. | CNBC, May 29, 2026.
3. Sovereign capital is now the marginal buyer of private assets.
Global SWF's 2026 report puts sovereign and public-pension investment into the US at roughly $132bn in 2025 — about half of everything those investors deployed worldwide. S&P Global Market Intelligence sharpens the divergence: sovereign-wealth-fund-backed deal value reached $199.9bn in 2025, up 198.4% year-on-year, while pension-backed deal value fell 5.46% to $74.31bn. Gulf and Asian funds — PIF, ADIA, Mubadala, QIA, GIC, Temasek — leaned into private markets exactly as parts of the pension world pulled back from the same vintages.
This changes who sets the price. When the marginal buyer of an infrastructure asset or a take-private is a sovereign balance sheet with a longer horizon and fewer liquidity constraints, valuations, deal structures, and co-investment terms bend toward its preferences. A pension allocator bidding for the same asset is increasingly negotiating against a counterparty with a different cost of capital and a different definition of risk.
Source: S&P Global Market Intelligence, Jan 9, 2026. | Global SWF, 2026 Annual Report. | Coverage: Sovereign Wealth Monitor.
4. CalPERS switches on a new operating system on July 1.
The 2026 policy redesign at CalPERS — the largest US public pension, with more than $556bn in assets — goes live on July 1. The board approved the change last November, and from July 1 the fund replaces its strategic asset allocation framework with a Total Portfolio Approach, dropping fixed per-asset-class targets in favour of judging each strategy on its risk and income contribution to the whole fund. CalPERS is the first US public pension to make the switch.
The timing is pointed: the change lands as the fund's private-markets book has been pressing against its old ceilings and as higher-for-longer rates reward holding illiquidity through a repricing. The question every other US board is now asking: does a total-portfolio model give a CIO genuine flexibility to hold illiquid assets through volatility, or does it quietly loosen the discipline that fixed ceilings were built to impose?
Source: Markets Media, June 2026. | Pensions & Investments. | Coverage: Pension Strategy Watch.
— Chart of the day —
Sovereign-fund-backed deal value nearly tripled in 2025 while pension-backed deals shrank.
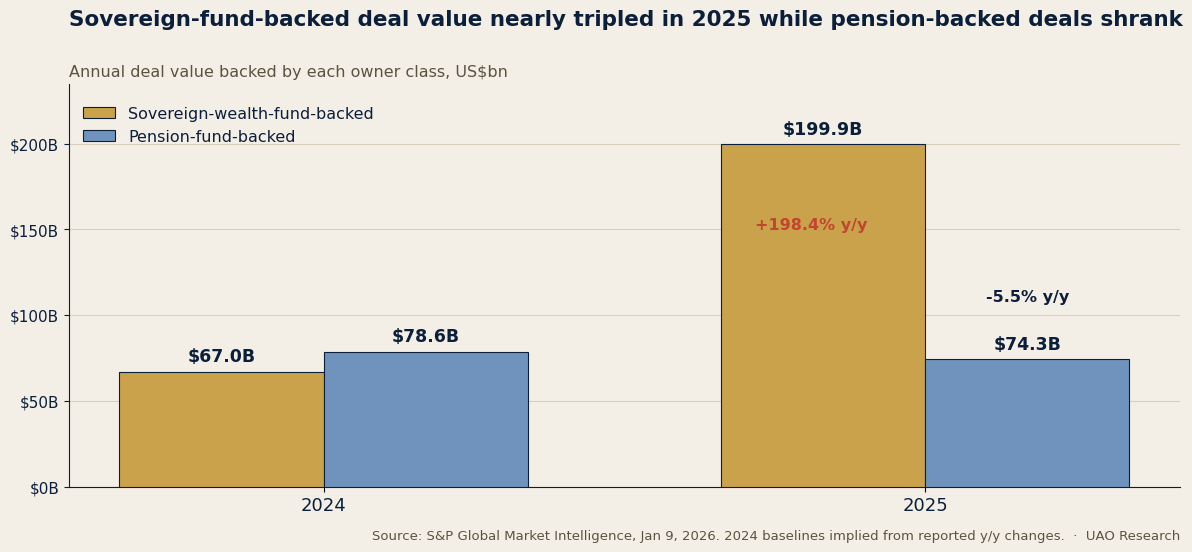
Source: S&P Global Market Intelligence, Jan 9, 2026. 2024 baselines implied from the reported year-on-year changes. UAO Research, 2026.
— Take of the day —
"The market is pricing cuts the new chair has not promised, and oil is doing the easing the Fed won't. Warsh's first job is to make the bias decision look like conviction rather than a forecast he'll have to walk back. Position for the easing put to be removed tomorrow — and for the cheaper-oil disinflation to hand the Fed room it spends slowly, not quickly."
— UAO Research.
— Three links worth your time —
- FXStreet — Warsh opens his first Fed meeting with a hold expected. The clearest read on what the dot plot and the debut press conference actually signal.
- S&P Global Market Intelligence — SWF deals soar as pension activity slows. The capital-flow divergence reshaping who prices private assets.
- Markets Media — CalPERS is the first US pension to adopt a Total Portfolio Approach. The governance change other large funds will be reading closely this summer.
*UAO Daily Brief. Researched and edited by the UAO editorial desk. N
|
Free Tool of the Day · 1 of 12
The Universal Owner Exposure Radar
When you own a slice of the whole economy, the threats that matter are systemic, not idiosyncratic. Set your allocation profile — Gulf sovereign, US pension, Canadian maple fund, EM-Asia GIC/Temasek-type, and more — and the Radar scores your exposure across the five forces you can't diversify away: climate transition, AI concentration, trade chokepoints, demographics, and liquidity stress. Then it shows how four stress scenarios would hit your book.
Coefficients seeded from public research — NGFS transition haircuts, index AI-concentration (~33%), IMF PortWatch chokepoint sensitivity, UN population trajectories, EIOPA liquidity stress. Free, no login to explore.
Run your exposure radar →
|