Chart of the Day
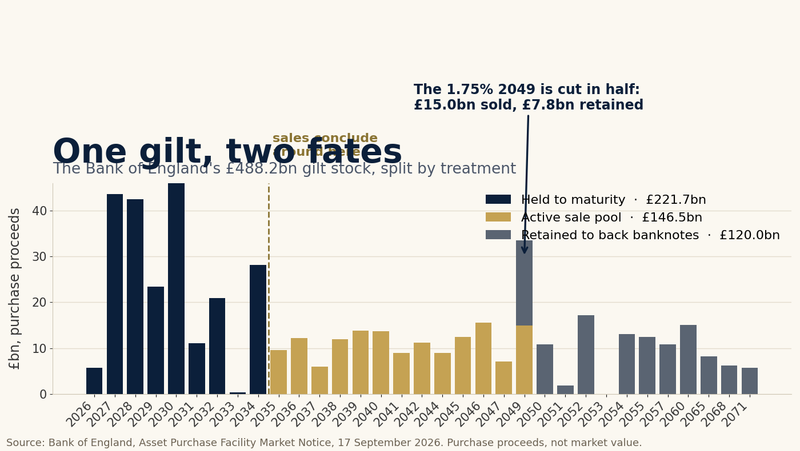
Bank of England gilt stock by treatment
The Bank of England's £488.2bn gilt stock, split three ways.
Visual signals for investors who need to understand the world beneath the headline.
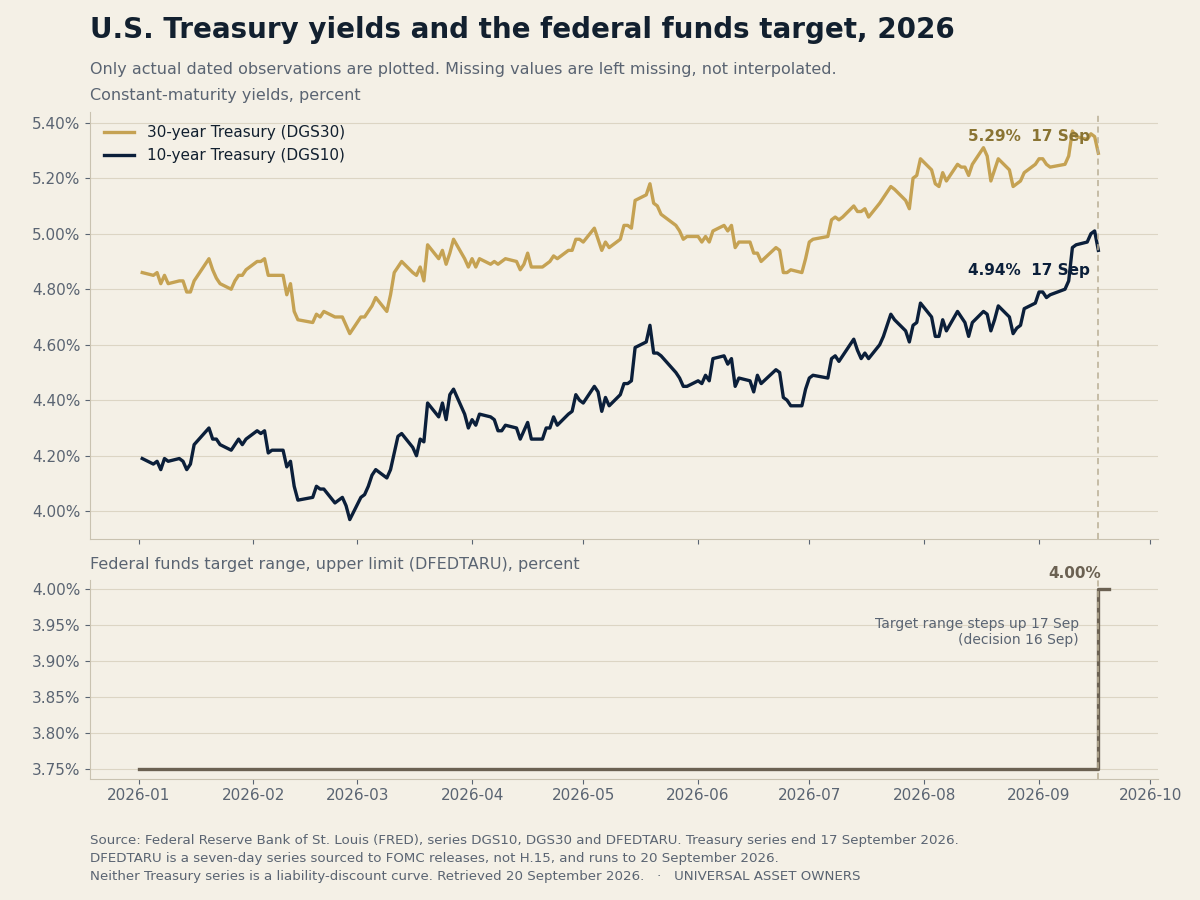
Federal Reserve Bank of St. Louis series DGS10, DGS30 and DFEDTARU. Treasury series end 17 September 2026; DFEDTARU is a seven-day series sourced to FOMC releases and runs to 20 September 2026. Only dated observations are plotted; neither Treasury series is a liability-discount curve. Retr
September 21, 2026
The Bank of England's £488.2bn gilt stock, split three ways.
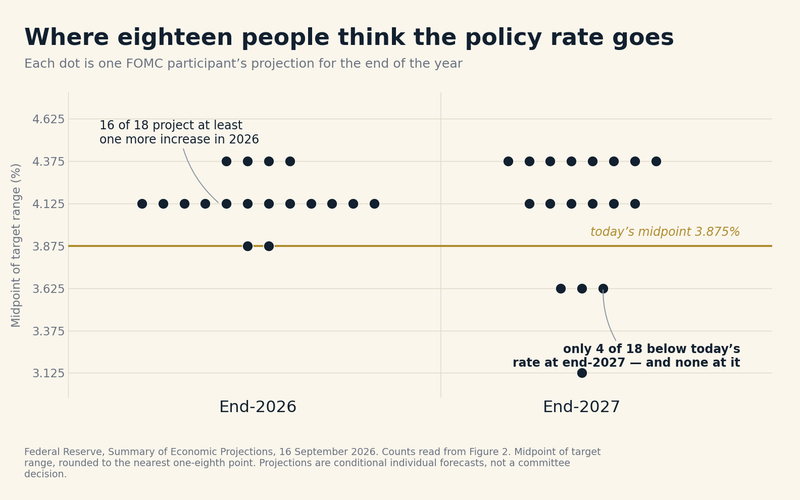
Federal Reserve, Summary of Economic Projections, 16 September 2026. Participant counts read from Figure 2.
The BIS, publishing the same morning, describes exactly that market — and measures it at its most permissive. Europe is not missing a virtue. It is missing an instrument.
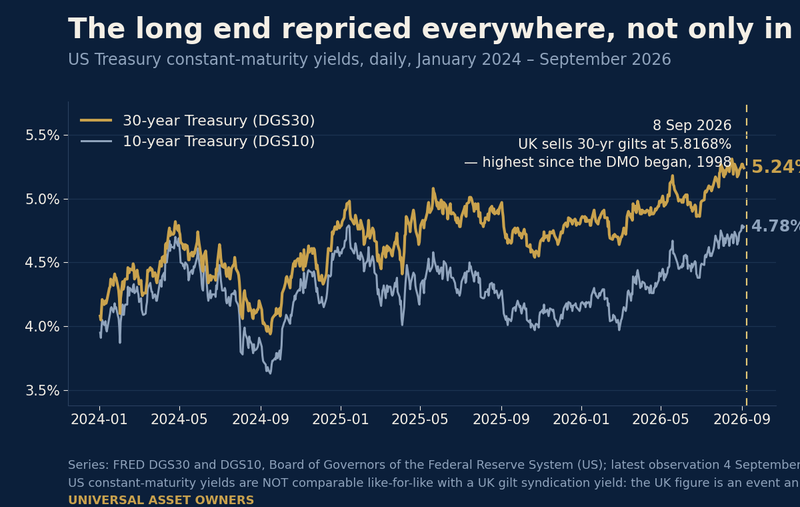
A day before the gilt sale, the UK government opened Modernising corporate reporting , published 7 September and closing 11:59pm on 30 November 2026 . Its stated objective is “supporting economic growth and strengthening the UK’s international competitiveness.” The proposals cover, in the
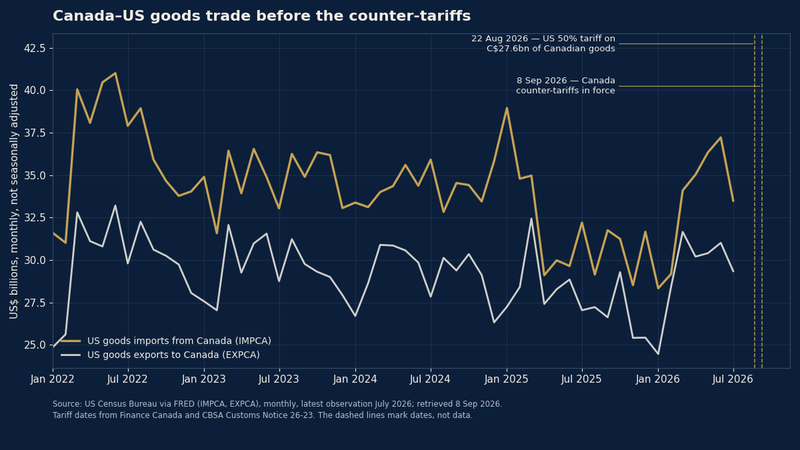
On 4 September 2026 the Securities and Exchange Commission filed, in the Eastern District of Pennsylvania, an application for an order to show cause and an order compelling Institutional Shareholder Services, Inc. to comply with an administrative subpoena. The docket is 2:26-mc-00078 ; the
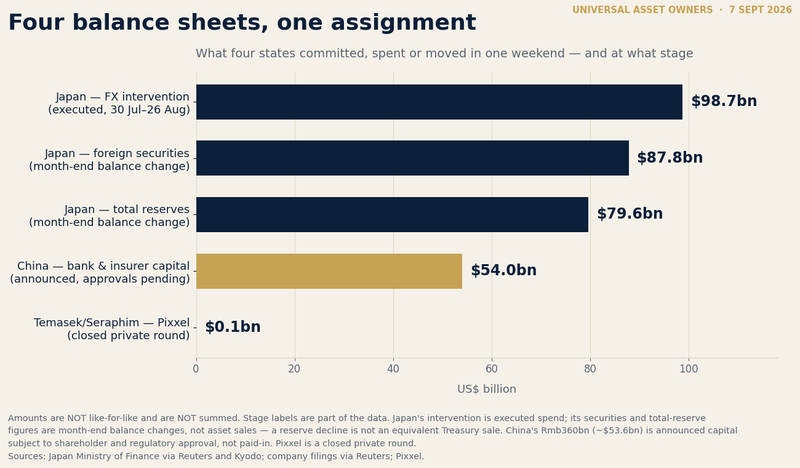
Japan’s Ministry of Finance reported that official reserves fell to $1,207.5 billion at the end of August, down $79.6 billion, or 6.18% , from $1,287.1 billion a month earlier. It is the largest monthly fall on record.
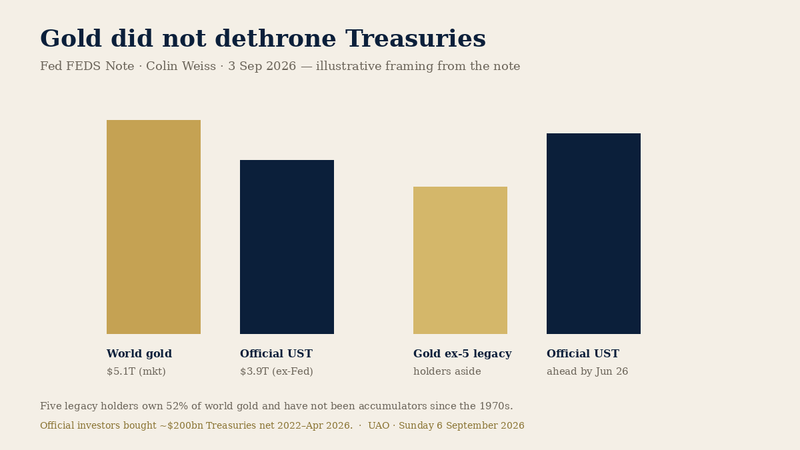
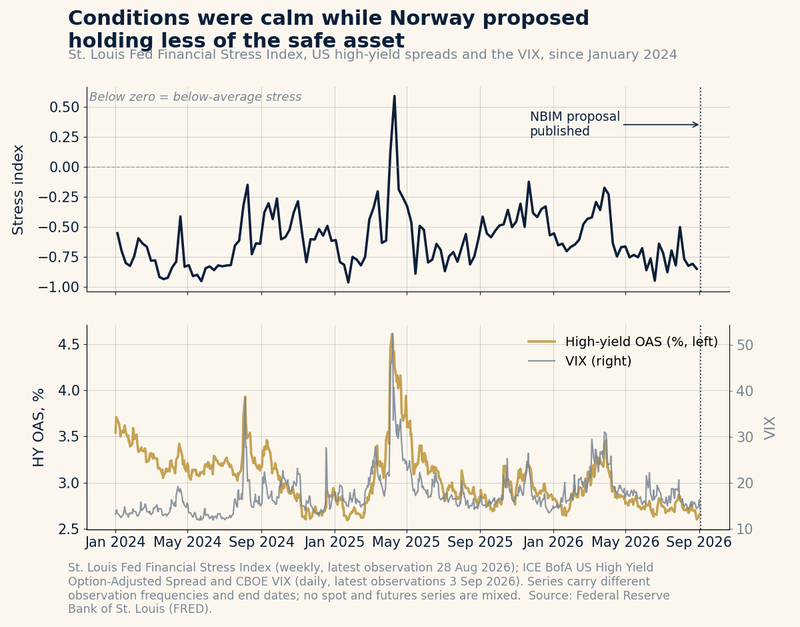
St. Louis Fed Financial Stress Index (weekly, latest observation 28 Aug 2026); ICE BofA US High Yield Option-Adjusted Spread and CBOE VIX (daily, latest observations 3 Sep 2026). Series carry different observation frequencies and end dates; no spot and futures series are mixed.
Research, charts, video and podcast analysis for the institutions investing at the scale of the world.
Five minutes, five days a week. Complimentary — subscriptions are reviewed by our editorial desk, and you'll receive a notice once approved.
You’re on the list. Tomorrow’s brief will arrive in your inbox.
Please enter a valid email.