The Probability Desk · Weekend Cinematic Flagship · 30 May 2026
Executive summary
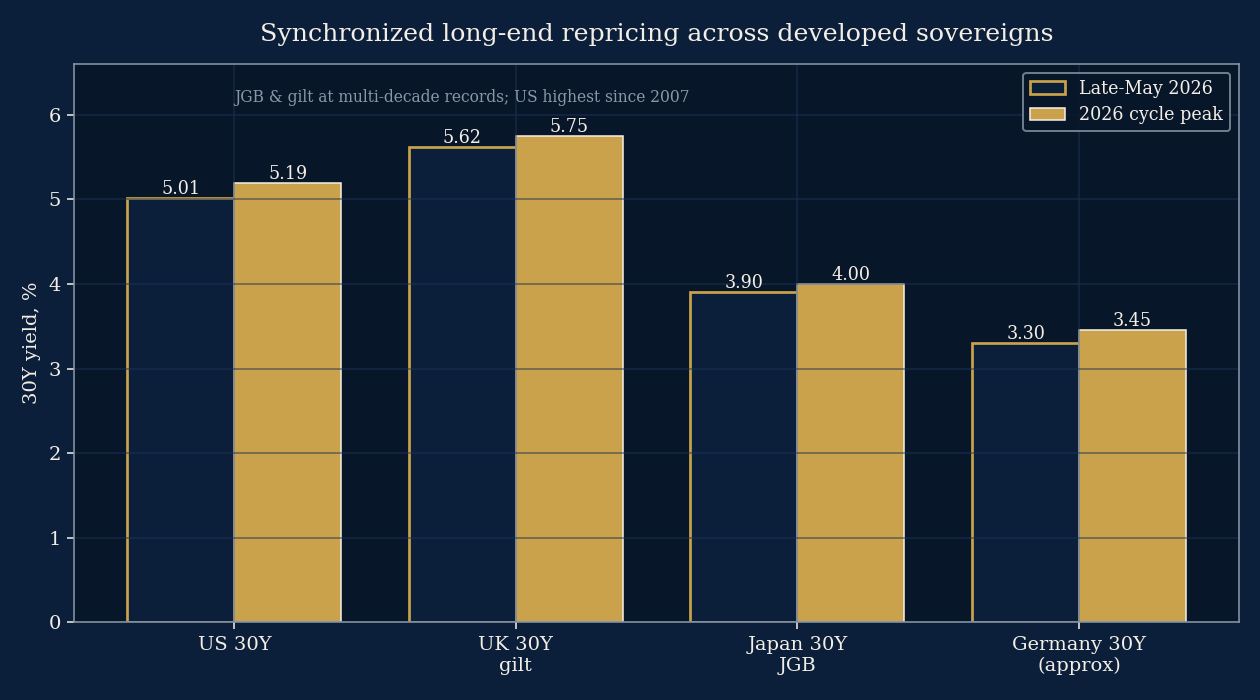
- The trigger. The US 30-year Treasury yield touched 5.19% on 19 May 2026 — its highest since before the 2007–08 crisis — and closed the week near 5.01%. It did not move alone: Japan's 30- and 40-year government bonds printed record highs, and the 30-year gilt reached its highest level since 1998. The long end of the developed world repriced together.
- The call. The Desk assigns a ~65% probability that the US 30-year yield closes at or above 5.50% on at least one trading day before 31 May 2027, and a ~30% probability it touches 6.00%. Confidence: moderate.
- The core evidence. A structural supply trajectory (a deficit near 5.8% of GDP and interest costs on track to double this decade), a synchronized global term-premium re-pricing, the loss of the United States' last triple-A rating, and the gradual retirement of price-insensitive long-end buyers.
- The main uncertainty. Whether a fiscal-credibility signal or a growth scare pulls the long end back down faster than the supply trajectory pushes it up. Both are live.
- The asset-owner implication. For universal owners, this is not a trade — it is a possible regime change. The 40-year tailwind that made long-duration liabilities cheap to fund and long-duration assets reliably appreciate may be ending. A permanently higher term premium reprices every long-dated cash flow an institution owns or owes.
Desk view, in one paragraph
The most important price in global finance is quietly resetting. After four decades in which the term premium — the extra yield long-bond holders demand for tying up money over decades — was compressed toward zero and occasionally below it, that premium is rebuilding across every major developed sovereign at once. The Desk's read is that this is more likely a regime shift than a spike: the forces pushing the long end higher (supply, fiscal trajectory, a thinner and more price-sensitive buyer base) are structural, while the forces that could pull it back down (a growth shock, a credibility-restoring fiscal package, a central-bank backstop) are episodic. We therefore lean toward "higher for longer at the long end," but with wide bands and explicit tripwires, because the long bond is also the asset most sensitive to a recession or a policy surprise.
The situation as of today
As of the week ending 30 May 2026, the US 30-year Treasury yield sits near 5.01%, having peaked intraday around 5.19% on 19 May. The 20-year is also near 5.01%; the 10-year is around 4.48% and the 2-year near 4.00%, leaving the 2s–10s curve modestly positive and the 10s–30s slope notably steep. Federal Reserve estimates of the 10-year term premium have moved back to clearly positive territory, reversing the negative readings that characterized much of the 2015–2021 period.
The move is global. Japan's super-long government bonds — the 30- and 40-year maturities — reached record highs in May, with the 30-year JGB near 3.9% and the 40-year above 4% (levels without modern precedent for instruments that yielded close to zero only a few years ago). The UK's 30-year gilt traded above 5.6%, its highest since 1998. Equity markets, by contrast, sat at or near record highs (the S&P 500 above 7,500, the Nasdaq Composite above 26,600), high-yield credit spreads were near cycle tights, and equity volatility was subdued. The divergence is the story: the long bond is the one major asset class not priced for perfection.
What changed
Three things shifted in the prior weeks. First, supply concern moved from background to foreground: a string of soft long-dated auctions earlier in the year — including a 2-year note auction where primary dealers absorbed roughly twice their normal share — signalled that demand is no longer keeping pace effortlessly with a growing calendar. Second, the United States lost its last triple-A rating when Moody's downgraded the sovereign to Aa1, ending a top-tier status held since 1917 and crystallizing the fiscal-trajectory narrative. Third, the global dimension became undeniable when Japanese and UK long bonds repriced in the same window — removing the "this is a US-specific story" comfort and pointing at a common factor: term premium.
Source Ledger
The Desk grounds this report in public, institutional sources. Confidence is graded H/M/L; "moves model" indicates whether the input materially shifted the probability.
| Source | Date | Data point | Conf. | Moves model |
|---|---|---|---|---|
| US Treasury daily par yield curve (Federal Reserve H.15) | May 2026 | 30Y 5.01%; intraday peak 5.19% (19 May) | H | Yes |
| CNBC market report | 19 May 2026 | 30Y tops 5.19%, highest since before 2008 crisis | H | Yes |
| Federal Reserve (ACM) term-premium estimate | May 2026 | 10Y term premium back to ~+0.83% | H | Yes |
| Bank of America Global Fund Manager Survey | May 2026 | 62% expect 30Y to reach 6% | M | Yes |
| Congressional Budget Office, Budget & Economic Outlook 2026–2036 | 2026 | FY2026 deficit ~$1.9T (5.8% of GDP); net interest $1.0T→$2.1T by 2036 | H | Yes |
| CBO Long-Term Budget Outlook | 2026 | Debt held by public rising past 120% by 2036, ~156% by 2055 | H | Yes |
| US Treasury Borrowing Advisory Committee (TBAC) charge | Q1 2026 | Trends in demand for Treasuries; heavy net issuance calendar | H | Yes |
| Committee for a Responsible Federal Budget | 2026 | First-two-months FY2026 deficit ~$439B | M | No |
| Moody's Ratings | 16 May 2025 | US downgraded Aaa→Aa1, last triple-A removed | H | Yes |
| CSIS analysis of Moody's downgrade | 2025–26 | Debt sustainability and reserve-status implications | M | No |
| CNBC / Bloomberg (Japan long-end) | May 2026 | 30Y & 40Y JGB record highs; 30Y ~3.9%, 40Y >4% | H | Yes |
| CNBC (UK gilts) | May 2026 | 30Y gilt above 5.6%, highest since 1998 | H | Yes |
| State Street Global Advisors (super-long JGB analysis) | 2026 | Structural supply/demand + term-premium repricing | M | Partial |
| Loomis Sayles, "An LDI Playbook for 2026" | 2026 | Pension demand yield-agnostic via glide paths; demand may outpace long IG supply | M | Yes |
| Resonanz Capital (Dutch pension transition) | 2026 | ~€100–125bn long-dated supply sold/not replaced through transition | M | Yes |
| Bank for International Settlements (CGFS, fixed-income demand) | — | Structural demand from liability-driven investors | M | Partial |
| Brookings, federal budget outlook update | 2026 | Trajectory not sustainable on current policy | M | No |
| J.P. Morgan Asset Management (downgrade implications) | 2025–26 | No forced selling; structural demand intact | M | Partial |
| Allianz Global Investors (debt sustainability) | 2025–26 | Term-premium pressure from sustainability concern | M | No |
| EIA energy data (inflation cross-check) | May 2026 | Brent ~$102; energy adding to inflation premium | H | Partial |
| FRED — Fed funds, core CPI index, 30Y mortgage | Apr–May 2026 | Fed funds ~3.64%; 30Y mortgage ~6.53% | H | Partial |
| Liquidity-screened prediction markets (rates cluster) | May 2026 | "30Y ≥5.6% this term" ~40%; "≥7% before 2027" ~25% | L | Partial |
| Bank of Japan policy commentary (normalisation) | 2026 | YCC aftermath; super-long supply pressure | M | Partial |
| Fidelity / BNY Investments downgrade explainers | 2025–26 | Institutional non-forced-seller framing | L | No |
The Desk reviewed additional market-implied and narrative-risk signals; those that did not meet the desk's liquidity and reliability thresholds are monitored qualitatively rather than included in the formal ensemble.
Key data table
| Variable | Current | Prior / reference | Direction | Source |
|---|---|---|---|---|
| US 30Y Treasury yield | 5.01% (5.19% peak) | ~4.6% start-2026 | ↑ | Fed H.15 |
| US 20Y Treasury yield | 5.01% | — | ↑ | Fed H.15 |
| US 10Y Treasury yield | 4.48% | — | ↑ | Fed H.15 |
| 10Y term premium (ACM) | ~+0.83% | negative, 2015–21 | ↑ | Federal Reserve |
| Japan 30Y JGB | ~3.9% (record); 40Y >4% | ~0% a few years ago | ↑↑ | Market reports |
| UK 30Y gilt | >5.6% (since-1998 high) | — | ↑ | Market reports |
| US HY credit spread (OAS) | ~2.71% (cycle tight) | wider in 2022–23 | ↓ | FRED/ICE BofA |
| Equity volatility (VIX) | ~16 | — | Low | FRED/Cboe |
| FY2026 federal deficit | ~5.8% of GDP | — | Wide | CBO |
| Net interest outlay | $1.0T (2026) | → $2.1T (2036) | ↑↑ | CBO |
| Fed funds rate | ~3.64% | higher in 2023–24 | ↓ | FRED |
The forecast question
Question: Will the US 30-year Treasury yield close at or above 5.50% on at least one trading day between 1 June 2026 and 31 May 2027?
Horizon: 12 months. Resolution: resolved YES on the first daily official closing yield ≥5.50%; otherwise NO at horizon. Base rate: see below. What would change it: a credible multi-year deficit-reduction package; a growth shock that triggers a flight to duration; a central-bank long-end backstop; or, in the other direction, a failed auction, an inflation re-acceleration, or a foreign-demand step-down.
Establishing the prior & analogues
Four reference classes anchor the base rate. The 1960s–1980s term-premium regime reminds us that a positive, sometimes large, term premium is the historical norm, not the exception; the compressed-premium era of 2012–2021 is the anomaly. That argues for a higher structural prior on elevated long yields. The 1994 bond-market rout shows how quickly the long end can reprice when the market re-rates the policy and supply path — relevant to the speed, not just the level. The 2013 "taper tantrum" shows a sharp term-premium re-build can be partly retraced when growth disappoints — a caution against extrapolating. The 2022–2023 inflation shock is the most recent analogue: yields rose far and fast, then stabilized at a higher plateau rather than reverting to the prior decade's lows. Synthesizing these, the Desk sets a prior of roughly 40% that the 30-year touches 5.50% within a year on base rates alone — already meaningful given the level only needs to rise ~49bp above spot and 31bp above the May peak.
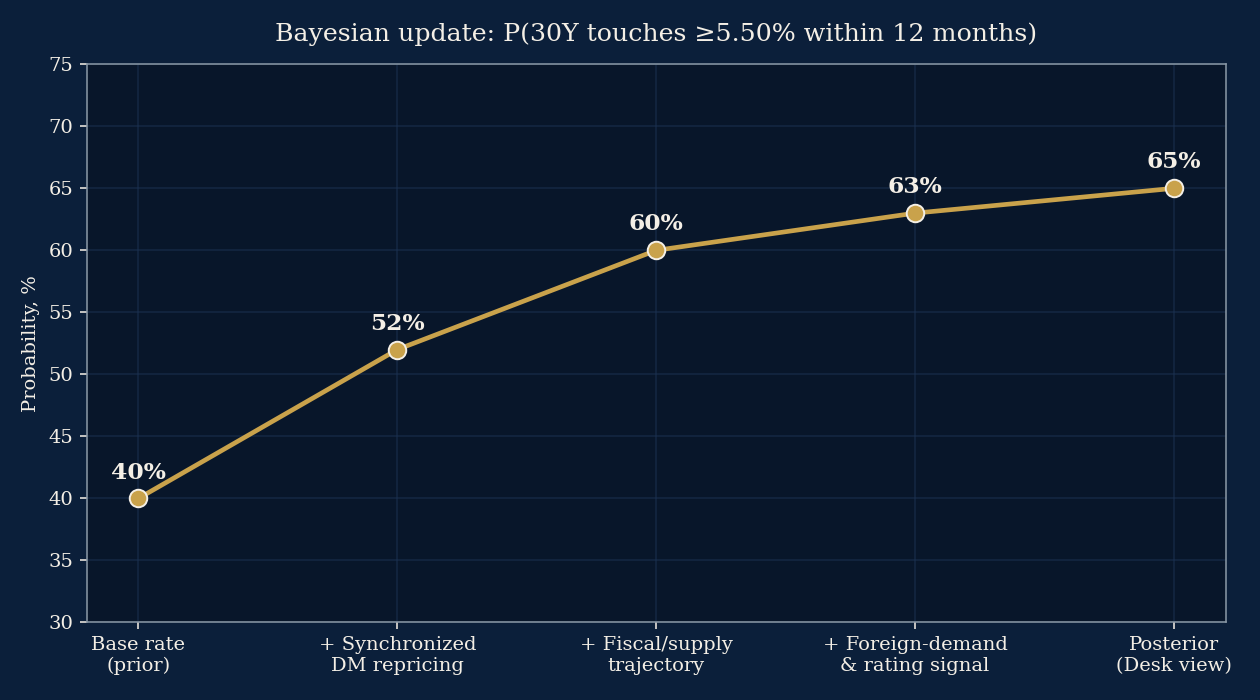
Updating the model (Bayesian)
The Desk updates the prior with the evidence that is verifiable today. The standard is strict: no probability is published unless the report shows the evidence that moved it.
| Evidence | Direction | Strength | Effect on P(touch ≥5.50%) |
|---|---|---|---|
| Synchronized DM long-end repricing (JGB & gilt records) | ↑ | Strong | 40% → 52% |
| Fiscal/supply trajectory (deficit ~5.8% GDP, doubling interest cost) | ↑ | Strong | 52% → 60% |
| Loss of last triple-A rating; foreign-demand sensitivity | ↑ | Moderate | 60% → 63% |
| BofA survey: 62% expect 6% (consensus already leaning up) | ↑ | Moderate | 63% → 66% |
| Structural LDI/pension demand for duration (price-agnostic glide paths) | ↓ | Moderate | 66% → 64% |
| Fed easing underway; growth-scare optionality on the long end | ↓ | Moderate | 64% → 65% |
| Posterior | ~65% | ||
The posterior is corroborated independently by the simulation below, which produces a blended touch-probability of 66% from a calibrated stochastic model — a coincidence the Desk treats as confirmation, not proof.
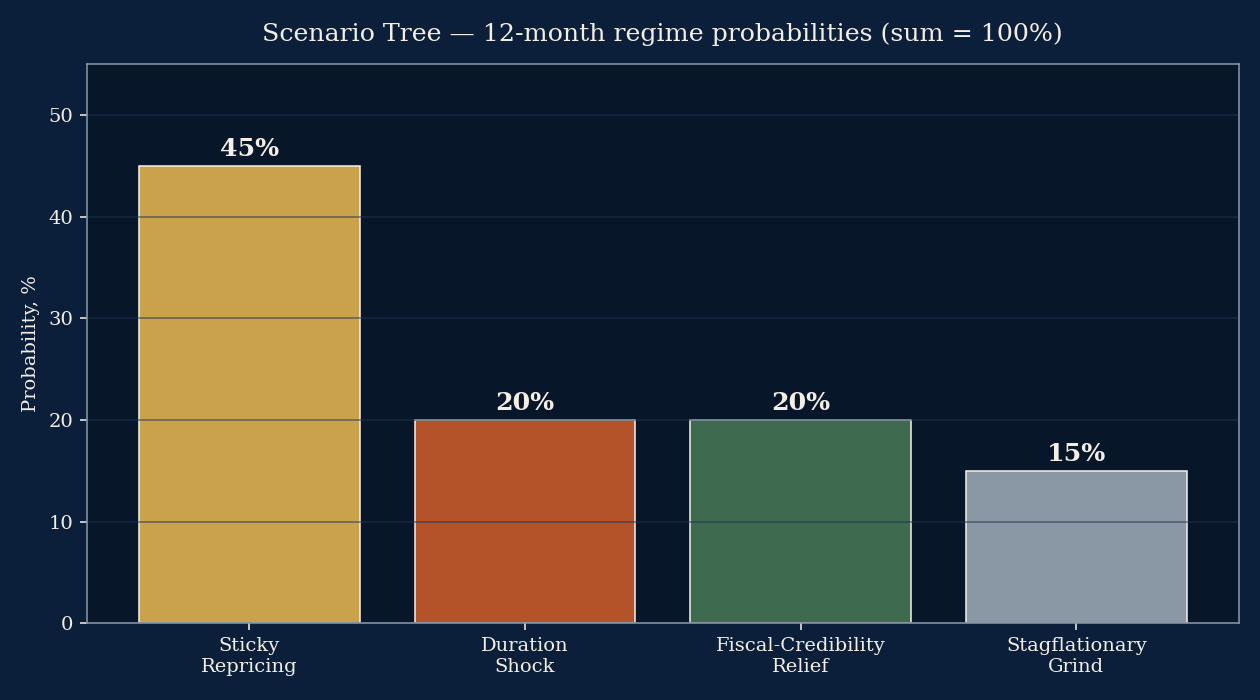
Scenario tree
Four scenarios, mutually exclusive and collectively exhaustive over the 12-month regime, summing to 100%.
| Scenario | Prob. | Narrative & key drivers | 30Y path | Asset-owner implication |
|---|---|---|---|---|
| Sticky Repricing (base) | 45% | Term premium settles structurally higher; supply pressure persists but no buyers' strike. Oscillates 4.8–5.6%. | Touches 5.50%; no runaway | Re-underwrite long-duration return assumptions; funding ratios improve at the margin |
| Duration Shock (tail-up) | 20% | Synchronized buyers' strike; failed auction(s); forced LDI/leverage unwinds amplify. 30Y ≥6.0%. | Breaks 6.0%+ | Mark-to-market pain on long books; liquidity and collateral stress; cross-asset contagion |
| Fiscal-Credibility Relief (benign-down) | 20% | Credible deficit path and/or growth scare; foreign and central-bank demand returns. Drifts toward 4.5%. | Often stays <5.50% | Long-duration assets rally; reinvestment yields fall; lock-in window closes |
| Stagflationary Grind (sideways-stress) | 15% | Inflation re-accelerates, Fed boxed in; high vol, no clean direction. 30Y 5.3–5.7%. | Touches 5.50%, choppy | Worst case for 60/40; real-asset and inflation-linked tilts rewarded |
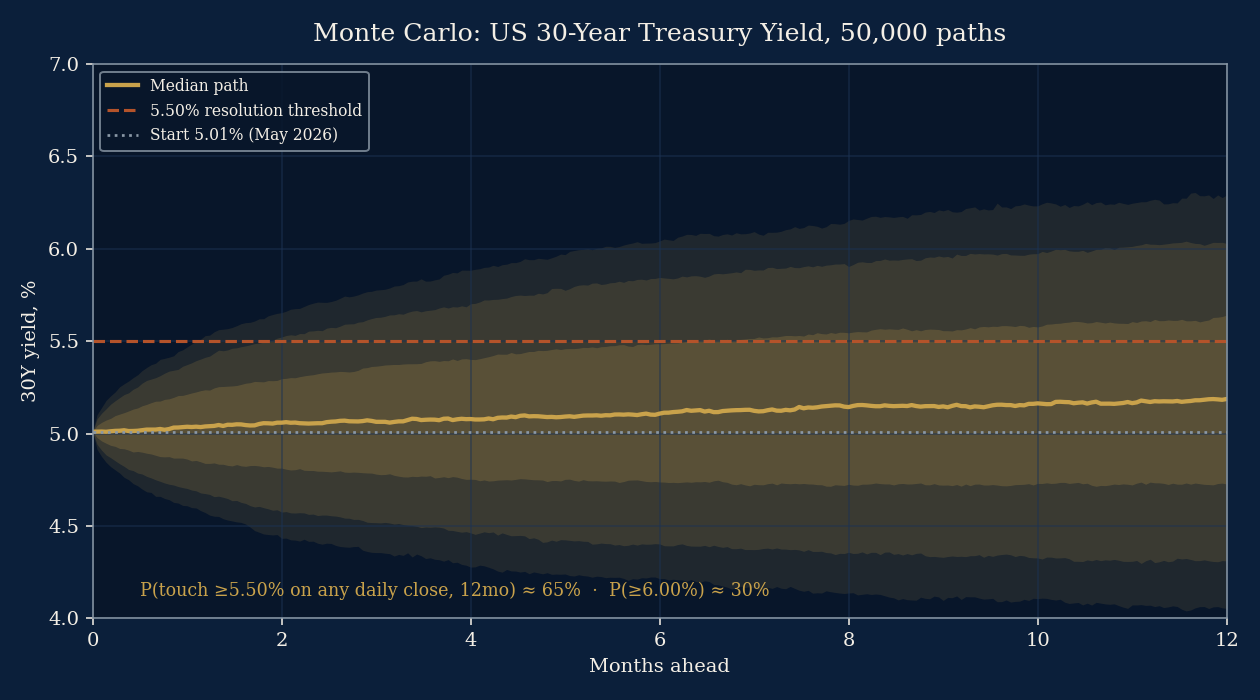
Simulation results
The Desk ran a Monte Carlo of 50,000 yield paths over 252 trading days, starting from the 30-year close of 5.01%. Daily changes follow a mean-reverting process with fat-tailed (Student-t, 5 degrees of freedom) innovations calibrated to recent realized long-end volatility (~6 basis points per day). Three regime calibrations — a base attractor of 5.35%, a stress attractor of 5.55% with higher volatility, and a benign attractor near spot with faster reversion — were blended 50/30/20.
| Output | Base | Stress | Benign | Blended |
|---|---|---|---|---|
| P(touch ≥5.50% on any close) | 67% | 73% | 52% | 66% |
| P(touch ≥6.00%) | 29% | 40% | 10% | 29% |
| Terminal 30Y, median | 5.19% | 5.25% | 5.04% | ~5.18% |
| Terminal 30Y, P10 / P90 | 4.34 / 6.05 | 4.17 / 6.34 | 4.41 / 5.67 | — |
Main drivers of the dispersion are the assumed attractor level (a proxy for where the structural term premium settles) and the daily volatility. Limitations: the model is a reduced-form statistical process, not a structural model of auctions, foreign flows, or fiscal policy; it cannot anticipate a discrete policy event (a credible fiscal package, a long-end backstop, a recession) that would shift the entire distribution. The fat-tailed innovations widen the bands but do not encode correlated cross-market blow-ups. The simulation is a discipline on the prose, not a forecast in itself.
Market pricing vs. Desk view
Consensus is already leaning the Desk's direction at the long end — a Bank of America survey found a majority of global managers expecting 6% — yet the rest of the capital structure is priced as if the long bond's message is noise. High-yield spreads near cycle tights, equity volatility near 16, and record equity indices imply markets do not believe a higher term premium will compress valuations or widen credit. The Desk's highest-conviction view is that this divergence is the mispricing: either the long end is wrong and will retrace (the Relief scenario), or risk assets are under-pricing the discount-rate and crowding-out consequences of a structurally higher long bond. The Desk does not assert which side blinks; it asserts that the two cannot both be right for long. What would prove the Desk wrong: the long end retraces below 4.50% and stays there while equities hold — implying the May repricing was a supply hiccup, not a regime change.
Universal-owner portfolio implications
This is the section that matters most for the audience. A structurally higher term premium is not a sector call; it is a discount-rate event that touches every long-dated cash flow an institution holds or owes. Strategic, not personalised, advice:
Liability-driven investors (DB pensions, insurers). The counter-intuitive good news: higher long yields raise the discount rate on liabilities and can improve funding ratios. The risk is on the asset side — long-bond and long-credit holdings mark down, and leveraged LDI structures can face collateral calls of the kind that stressed UK pensions in 2022. The retirement of price-insensitive long-end buyers (the Dutch DB-to-DC transition is removing an estimated €100–125bn of structural demand through its transition window) thins the bid precisely as supply grows.
Sovereign wealth funds and reserve managers. A higher, positive term premium makes high-quality duration a genuine asset again after a decade of return-free risk — but it also raises the question Gulf and Asian reserve holders are asking aloud: how much US duration to hold when the issuer has lost its last triple-A and the dollar's structural bid is debated. Expect gradual diversification at the margin, not a rupture.
Equity-heavy endowments and growth allocators. The long bond is the denominator. Record equity indices led by long-duration growth and AI names are the most exposed to a sustained rise in the risk-free discount rate. Concentration risk and duration risk are, for these portfolios, the same risk wearing two hats.
Private markets. Private equity and private credit marks lag public repricing; a higher-for-longer long end raises the hurdle rate, pressures exit multiples, and lengthens hold periods. The mark-to-market relief of "private" smoothing is borrowed, not earned.
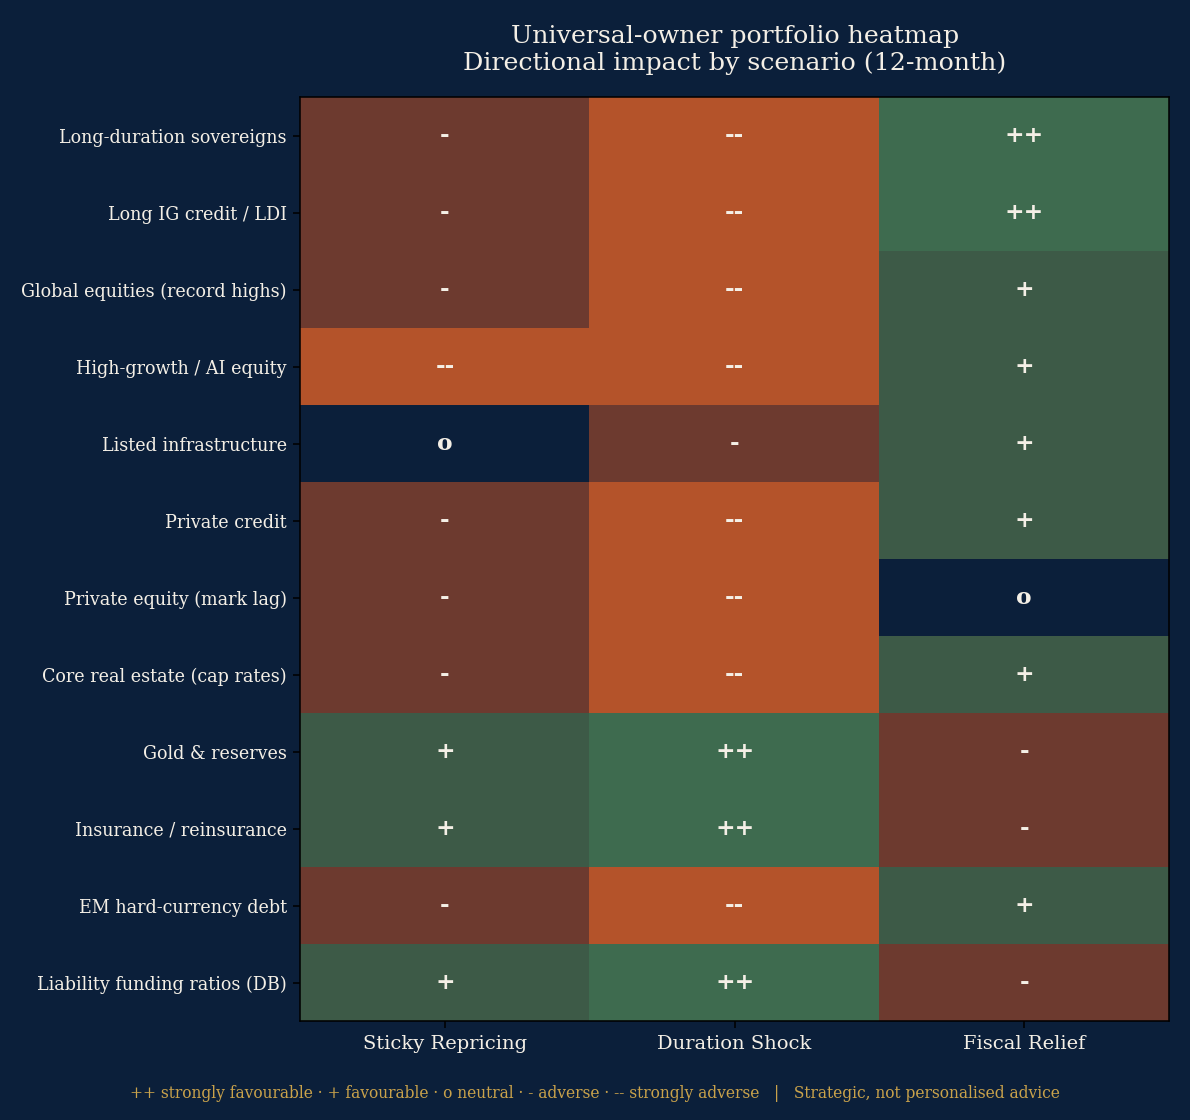
The portfolio heatmap in the visual appendix summarizes directional impact by scenario across twelve asset-owner exposures.
Second- and third-order effects
A durably higher long end radiates outward. Fiscal reflexivity: higher yields raise interest outlays, which widen deficits, which raise issuance, which can raise yields further — the loop CBO's interest-cost path quietly describes. Mortgage and housing transmission: a 30-year mortgage near 6.5% keys off the long end, with consumption and construction consequences. Corporate refinancing wall: issuers that termed out cheaply in 2020–21 face a step-change in refinancing cost as maturities roll. Cross-border contagion: synchronized DM long-end moves limit the diversification benefit of holding multiple sovereigns — the correlation that universal owners cannot escape. Reserve-currency debate: sustained term-premium plus rating erosion keeps the "alternatives to Treasuries" conversation alive among large reserve holders. Carry and currency: a weak yen near 159 and shifting rate differentials make the Japanese long end a global volatility source, not a backwater.
What we're watching
| Indicator | Why it matters | Threshold that changes the model |
|---|---|---|
| 30Y daily close | The resolution variable | ≥5.50% resolves YES; sustained <4.50% favours Relief |
| Long-dated auction tails & dealer takedown | Demand-supply balance | Repeated tails / dealer share >20% = Duration Shock risk |
| 10Y term-premium estimate | The structural driver | Rising through +1.0% confirms regime |
| Japan 30Y/40Y JGB | Global term-premium proxy | Fresh records = synchronized pressure |
| UK 30Y gilt | Fiscal-credibility canary | New highs reinforce common factor |
| HY credit spread (OAS) | The divergence gauge | Widening >3.5% = risk assets capitulating to the bond message |
| Foreign official holdings (TIC) | Demand step-down | Sustained net selling by large holders |
| Core inflation trajectory | Stagflation tripwire | Re-acceleration locks in higher long yields |
| Fiscal-package news flow | Relief catalyst | Credible multi-year deficit path = down-shift |
| MOVE index (rate vol) | Stress amplifier | Spikes precede disorderly moves |
Visual appendix
The visual package accompanying this report comprises the Monte Carlo fan chart, the scenario-probability tree, the Bayesian prior-to-posterior path, the synchronized global long-end comparison, and the universal-owner portfolio heatmap. Each is built from the data cited above.
Red-team: how this could be wrong
The Desk argues against itself. The supply story is over-told. Markets have known the deficit path for years; if it were sufficient to drive yields, they would already be higher — the May move may be a positioning flush, not a regime change. Structural demand is underrated. Pension glide paths and insurer liability-matching are price-insensitive buyers of duration; at 5%+ the long bond is attractive on a multi-decade liability framework, and that bid could cap yields faster than the Desk assumes. The 5.50% threshold is close to spot, so a high touch-probability partly reflects proximity rather than conviction about a regime — a fair critique the Desk acknowledges by separating the touch-probability from the terminal-regime scenarios. A growth scare flips everything: the long bond is the premier recession hedge, and any meaningful slowdown would pull yields down hard, making the entire "higher for longer" thesis look premature. Global comparison can mislead: the JGB and gilt moves have idiosyncratic drivers (Bank of Japan normalisation, UK fiscal politics) that may not share a common cause with the US. The Desk's confidence is therefore moderate, not high, and the Relief scenario carries a deliberate 20% weight.
Methodology box
The Probability Desk uses a proprietary ensemble methodology combining public filings and official data, macroeconomic and rate inputs, market-implied signals, expert-prior analysis, base-rate research, and scenario analysis. Inputs are weighted on recency, reliability, liquidity, relevance, and institutional materiality. The probability in this report reflects the input classes that met the desk's publication thresholds — base-rate evidence, official fiscal and rate data, a calibrated Monte Carlo simulation, and expert-prior analysis. Market-implied prediction-market signals in the rates cluster were reviewed; those that did not meet the desk's liquidity and reliability thresholds are monitored qualitatively rather than included in the formal ensemble. A narrative-risk simulation layer is used to assess second-order and contagion pathways; where its signal does not meet the publication threshold it is monitored rather than scored. No probability is published unless the report shows the evidence that moved it.
Disclaimer
This report is for informational and research purposes only and does not constitute investment, legal, tax, or financial advice. Editorial