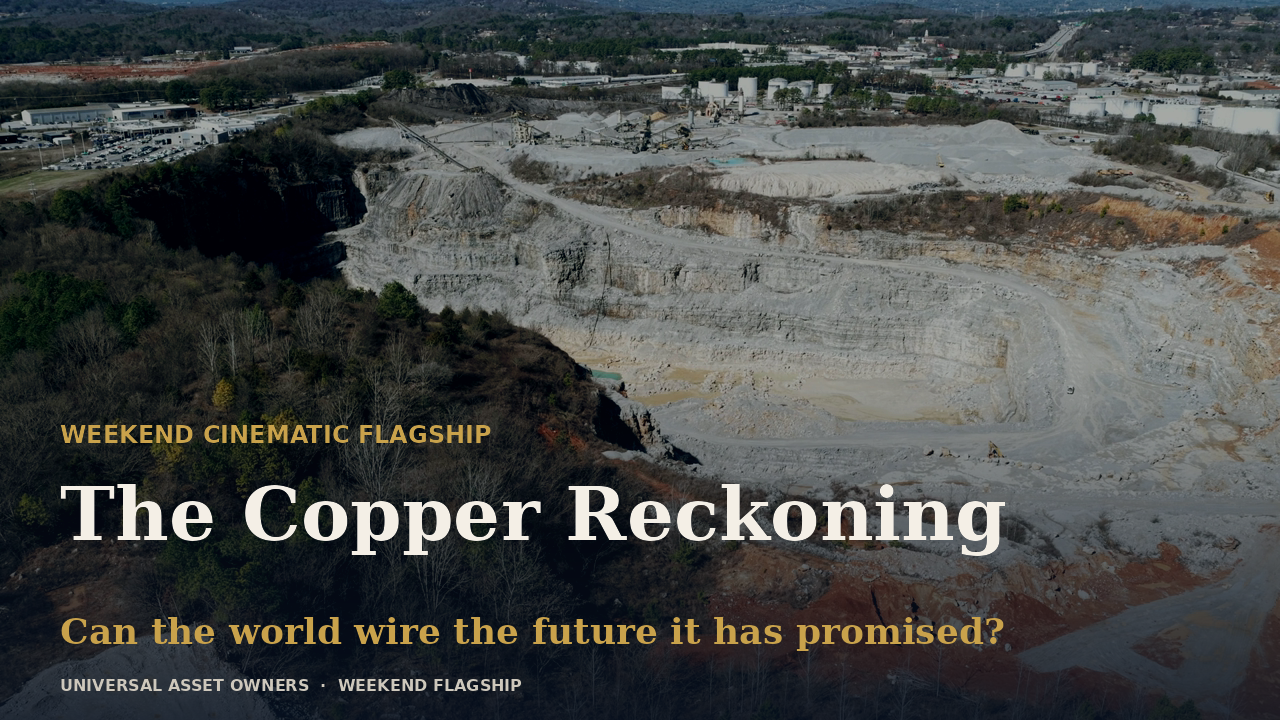
The Copper Reckoning — the weekend cinematic. Press play, then read the full scenario report below.
Executive summary
Copper has quietly become the most important commodity that almost no allocation committee has a deliberate position on. The metal sits at the intersection of the two largest capital-formation stories of the century — the electrification of the energy system and the physical build-out of artificial intelligence — and on the current trajectory the world does not have enough of it. The London Metal Exchange three-month price is trading near record territory — its 4 June close was roughly US$13,900 a tonne, with spot near US$13,700 — having printed an intraday high above US$14,500 earlier this year, and it slipped close to four per cent on 5 June as an energy-driven inflation scare raised the spectre of tighter monetary policy. The International Copper Study Group has abandoned its surplus forecast and now expects the refined market to swing into a deficit of roughly 150,000 tonnes in 2026, the first structural shortfall since 2009. A cluster of severe mine accidents in 2025 — Grasberg in Indonesia, El Teniente in Chile, Kakula in the Democratic Republic of Congo — has removed several hundred thousand tonnes of expected output, and the bank desks have responded by lifting forecasts even as Goldman Sachs argues the incentive price still caps the metal nearer US$11,000 over the next two years.
This report puts a number on the near-term tension and frames the structural one. Our resolvable forecast question is narrow and gradeable: will the LME three-month copper price close at or above US$15,000 a tonne on at least one trading day between 1 July 2026 and 30 June 2027? Our central estimate, drawn from a 50,000-path Monte Carlo calibrated to the deficit balance, the disruption record and the genuine disagreement among forecasters, is 65 per cent. The same simulation puts roughly an 18 per cent probability on the price ending the window below US$11,000 — the bear case is real, not rhetorical.
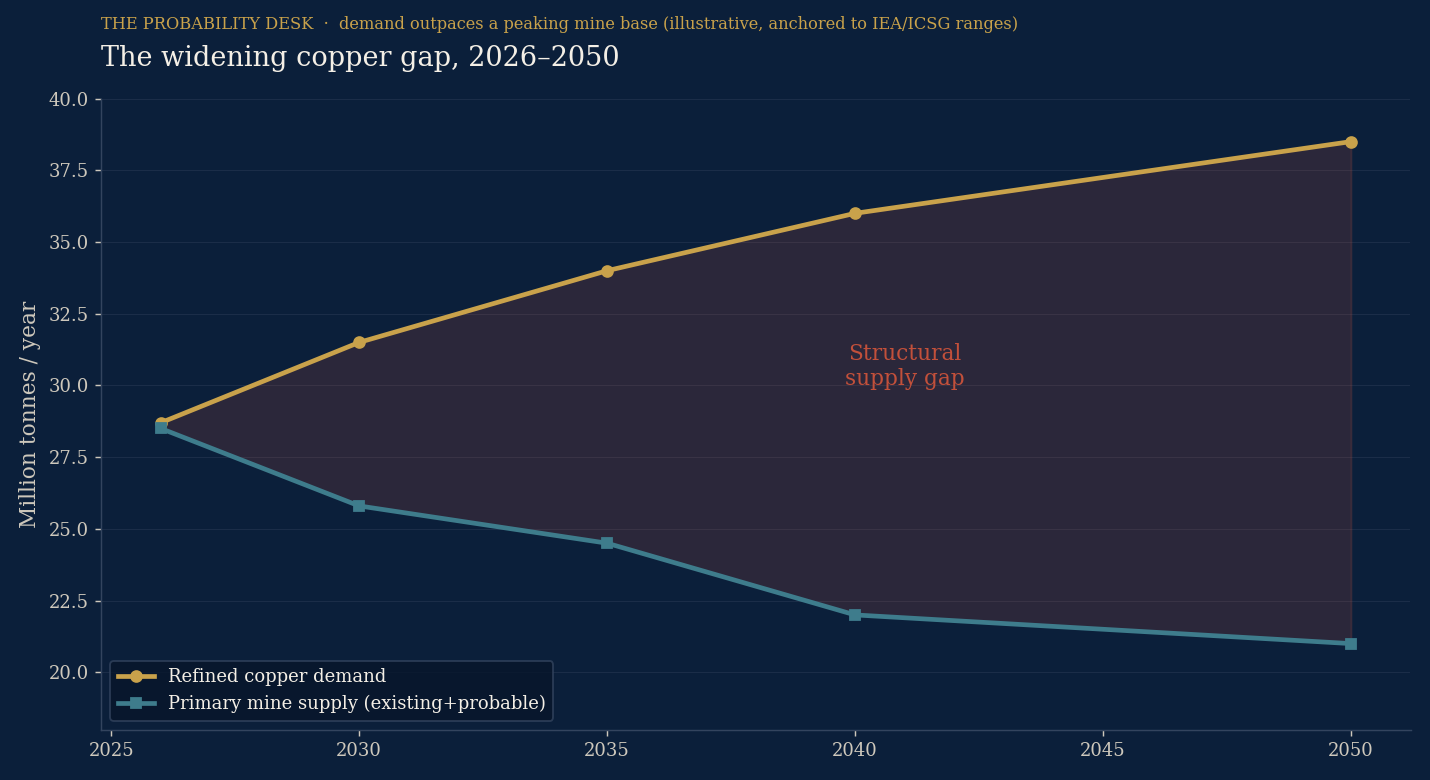
The longer story is the one universal owners should actually underwrite. Under the International Energy Agency’s scenarios, primary mine output peaks near 25.8 million tonnes around 2030 and then declines, while demand on a stated-policies path climbs toward 34 million tonnes by 2035 and nearly 40 million tonnes in a net-zero world by 2050. The gap is structural, the lead times are brutal — seventeen years on average from discovery to production, longer in the United States — and the marginal new pound of copper comes from lower grades at higher cost. For an owner of the whole market, the question is not whether to trade copper. It is whether the portfolio is positioned for a quarter-century in which the physical constraint on growth migrates from capital and chips to electrons and the metal that carries them.
Desk view, in one paragraph. The cyclical and the structural point the same way for once. A tight near-term balance, a damaged supply base and an AI-and-grid demand impulse make another leg higher more likely than not over the coming year, and we hold a 65 per cent probability that copper touches US$15,000. But the bull case is crowded and the metal is already pricing a great deal of good news; the credible bear case is a demand air-pocket — a hard landing, an AI-capex pause, or a Chinese property capitulation — against which there is little valuation cushion. Over the 25-year horizon the asymmetry is clearer: the world has committed to electrifying and computing its way forward and has not committed the mine capital to supply it. That is a slow, compounding tailwind for the metal and a slow, compounding cost for everyone who must buy it.
The situation as of today
Three facts define the copper market in June 2026.
First, the price is high and the curve is tense. The LME three-month contract closed near US$13,900 a tonne on 4 June and trades around US$13,700, within reach of the record set intraday earlier in the year — though it gave back close to four per cent on 5 June, a reminder of how two-sided this market has become. The latest monthly LME reference printed roughly US$13,480 a tonne — a level that two years ago would have been treated as an aberration and is now the working assumption.
Second, the balance has flipped. The International Copper Study Group, the most cited neutral arbiter of the refined market, has withdrawn the surplus it previously projected and now forecasts a deficit of about 150,000 tonnes in 2026, citing slower production growth rather than a demand surge. It cut its 2025 mine-production growth estimate to 1.4 per cent from 2.3 per cent after disruptions in Indonesia, Chile and the Democratic Republic of Congo. Bank desks reach larger numbers: J.P. Morgan’s modelling implies a shortfall in the order of 330,000 tonnes, and several houses put the disruption-adjusted 2026 deficit above 400,000 tonnes. The supply damage is proving durable rather than transient: Grasberg’s full restart has slipped to early 2028 on a phased recovery path, and El Teniente faces a multi-year recovery timeline — both deeper and longer than the market assumed when the accidents occurred.
Third, policy has fractured the price. Since August 2025 the United States has applied a 50 per cent Section 232 tariff to semi-finished copper products and copper-intensive derivatives, and on 1 June 2026 the administration signed a fresh proclamation adjusting the regime from 8 June 2026 through end-2027. The result is a structurally elevated COMEX-over-LME premium — at its mid-2025 peak the COMEX contract traded more than 30 per cent above LME, against a five-year average under 1 per cent — that distorts physical flows, pulls metal toward US ports and complicates any single-price reading of “the” copper market.
What changed in the last week
The immediate catalyst for revisiting copper now is the 1 June 2026 Section 232 proclamation, which extended and adjusted the copper tariff regime and reopened the arbitrage question for traders and physical buyers into 2027. Set against an oil market already disrupted by the Strait of Hormuz situation and a broad US dollar index near multi-year highs, the relative-value case for hard assets with a genuine supply story — rather than a purely monetary one — has sharpened. Copper is the cleanest such story: a metal whose scarcity is being written into the geology and the permitting calendar, not merely into a central-bank balance sheet.
Source ledger
Institutional and primary sources underpinning this report. Confidence graded H/M/L. “Moves model” indicates whether the data point materially shifted the probability.
| # | Source | Date | Data point | Conf. | Moves model |
|---|---|---|---|---|---|
| 1 | International Copper Study Group | Oct 2025 | 2026 refined market deficit ~150kt, swung from +209kt surplus | H | Yes |
| 2 | International Copper Study Group | Oct 2025 | 2025 mine-production growth cut to 1.4% from 2.3% | H | Yes |
| 3 | International Copper Study Group | Oct 2025 | 2026 refined usage +2.1% to 28.7 Mt | H | Yes |
| 4 | International Energy Agency | 2024–25 | Mine supply peaks ~25.8 Mt 2030, declines to ~22 Mt by 2040 | H | Yes |
| 5 | International Energy Agency | 2024–25 | ~30% supply gap by 2035 (STEPS); >40% under net-zero | H | Yes |
| 6 | International Energy Agency | 2025 | Data-centre copper demand 250–550kt/yr by 2030 | H | Yes |
| 7 | S&P Global Commodity Insights | Jan 2026 | “Substantial shortfall” widens; AI + defence add to demand | H | Yes |
| 8 | S&P Global / Codelco | 2026 | Codelco portfolio grades fallen to ~0.66% (from ~1.02% in 2022); global avg ~0.6–0.7% | H | Yes |
| 9 | Goldman Sachs Research | 2026 | LME forecast to ~US$15,000/t by 2035 (~US$11,500 2025-real); incentive curve caps near US$11,000 2026–27 | H | Yes |
| 10 | Citigroup | 2026 | Sees copper ~US$14,500 near-term, US$15,000 within a year | M | Yes |
| 11 | World Bank Commodity Outlook | 2026 | LME averages ~US$9,800/t 2026, toward US$10,000 in 2027 | H | Yes |
| 12 | Freeport-McMoRan / reporting | 2025 | Grasberg flooding; 2026 output pruned to ~500kt (from ~730kt) | H | Yes |
| 13 | Codelco / reporting | Aug 2025 | El Teniente tunnel collapse; 2025 output ~316kt (from ~370kt) | H | Yes |
| 14 | Ivanhoe Mines / reporting | 2025 | Kakula (DRC) flooding; sharp 2025–26 output cut from ~437kt base | H | Yes |
| 15 | Benchmark Mineral Intelligence | 2025 | ~600kt contained copper lost from Grasberg through end-2026 | M | Yes |
| 16 | J.P. Morgan Global Research | 2026 | Modelled 2026 shortfall ~330kt; data centres ~475kt copper in 2026 | M | Yes |
| 17 | FT Commodities Summit reporting | 2026 | Avg. 17 yrs discovery-to-production; US permitting up to ~30 yrs | H | Yes |
| 18 | Tom’s Hardware / industry data | 2025–26 | AI data-centre copper ~1.1 Mt/yr by 2030 (~4% of demand) | M | Supports |
| 19 | Carbon Credits / market data | 2025–26 | Copper demand ~37 Mt by 2050; ~40 Mt under net-zero | M | Supports |
| 20 | US Congressional Research Service | 2025 | Section 232 50% tariff on semis/derivatives from Aug 2025 | H | Context |
| 21 | White House proclamation | 1 Jun 2026 | Section 232 copper regime adjusted, effective 8 Jun 2026–end-2027 | H | Context |
| 22 | Benchmark / Fastmarkets | 2025 | COMEX premium peaked >30% over LME (5-yr avg <1%) | H | Context |
| 23 | US Federal Reserve economic data | Jun 2026 | LME copper monthly ref ~US$13,480/t; Brent ~US$98/bbl | H | Anchor |
| 24 | Rio Tinto guidance / reporting | 2026 | Targeting ~15% production lift to help meet 300–400kt 2026 gap | M | Supports |
| 25 | Yahoo Finance / market reporting | 2026 | Copper rally described as “unsustainable” by some desks; silver/gold parallel | L | Counter |
| 26 | Shanghai Metal Market (SMM) | 2025 | Disruption tally; major mines cut/halt; deficit forecast | M | Yes |
| 27 | MINING.COM | 2026 | Tight supply + tariff risk frame 2026 as volatile | M | Context |
| 28 | Argus Media | 2026 | US copper 2026 outlook uncertain; tariff-driven flow shifts | M | Context |
| 29 | Sprott Insights | 2025–26 | “Copper premium” — policy risk meets physical scarcity | L | Counter-frame |
| 30 | Investing.com analysis | 2026 | Institutional rotation into copper; deficit + technicals | L | Sentiment |
| 31 | International Energy Agency (Critical Minerals Outlook) | 2025 | China ~45% of refined copper output (to ~50% by 2040); only 14 new deposits found in past decade vs 225 prior; US$500–800bn investment needed by 2040 | H | Yes |
| 32 | Reporting / company guidance | May–Jun 2026 | Grasberg full restart slipped to early 2028; El Teniente multi-year recovery; Codelco 2026 output guided ~1.34 Mt | H | Yes |
Sources 25, 29 and 30 are lower-confidence secondary or sentiment reads and are included as counter-evidence and crowding signals, not as model inputs. All model-moving figures (rows 1–17, 23, 31–32) are anchored to primary bodies (ICSG, IEA, World Bank, US government) or to direct company guidance and live market data.
Key data table
| Variable | Current reading | Prior / comparison | Direction | Source | Conf. |
|---|---|---|---|---|---|
| LME 3-month copper | ~US$13,700/t (3M close 4 Jun) | ~US$9,500/t (2-yr avg) | ↑↑ | London Metal Exchange | H |
| LME intraday high (YTD) | >US$14,500/t | — | record | reporting | M |
| ICSG 2026 refined balance | −150 kt (deficit) | +209 kt (prior forecast) | flipped | ICSG | H |
| 2026 disruption-adjusted deficit (banks) | 330–400+ kt | balanced 2025 | ↑ | JPM / SMM | M |
| 2025 mine-production growth | 1.4% | 2.3% (prior) | ↓ | ICSG | H |
| Average ore grade (Codelco portfolio) | ~0.66% Cu | ~1.02% Cu (2022) | ↓ | S&P Global / Codelco | H |
| Discovery-to-production lead time | ~17 yrs (US to ~30) | — | structural | FT Summit | H |
| Data-centre copper demand (2030) | 250–550 kt/yr | negligible (2020) | ↑↑ | IEA | H |
| Mine supply peak | ~25.8 Mt ~2030 | rising base | peak-then-fall | IEA | H |
| Demand (2035 / 2050) | ~34 Mt / ~37–40 Mt | ~28.7 Mt (2026) | ↑↑ | IEA / industry | H |
| COMEX premium over LME (peak) | >30% | <1% (5-yr avg) | distortion | Benchmark | H |
| US Section 232 copper tariff | 50% on semis/derivatives | n/a (pre-2025) | policy | CRS / WH | H |
| Brent crude (context) | ~US$98/bbl | ~US$66 (yr ago) | ↑↑ | US Federal Reserve data | H |
| Broad USD index (context) | ~118.9 | — | strong | US Federal Reserve data | H |
The forecast question
Will the LME three-month copper price close at or above US$15,000 per tonne on at least one trading day between 1 July 2026 and 30 June 2027?
- Horizon: twelve months (1 Jul 2026 – 30 Jun 2027).
- Resolution criterion: a single official LME closing print at or above US$15,000/t resolves YES. No touch resolves NO.
- Base rate: copper has approached but never sustainably closed at US$15,000/t; the prior anchor for a fresh record-cap touch within a 12-month window of an already-elevated, deficit market is roughly 45 per cent (see prior section).
- What success looks like: the Desk’s posterior probability lands close to the realised outcome and the calibration log records a well-reasoned, evidence-weighted call.
- What would change it: a confirmed demand air-pocket (recession, AI-capex pause, Chinese property capitulation), a faster-than-expected restart at Grasberg/El Teniente/Kakula, or a synchronised destocking that drains the squeeze.
A twelve-month touch question is deliberately chosen over a year-end level question: the metal’s defining feature now is convex, jump-prone upside risk from supply shocks, and a touch question captures that path-dependence honestly. The same simulation also reports the year-end distribution so the structural and the tactical views are both legible.
The prior and the analogues
We anchor the prior in five reference episodes, each instructive and each potentially misleading.
1. The 2006 and 2011 copper peaks. Copper has had two prior super-cycle moments — the China-industrialisation surge to a 2011 record and the 2006 spike — both of which mean-reverted hard once supply caught up and Chinese demand cooled. Relevance: records in copper have historically been cyclical tops, not new floors. Why it may mislead: neither prior cycle had a structural mine-supply peak or an AI-electrification demand vector layered on top.
2. The 2021–22 post-pandemic squeeze. Copper ran to then-records on stimulus, restocking and green-transition narrative, then gave much of it back as rates rose and China’s property sector seized. Relevance: the metal is highly sensitive to the Chinese construction cycle and to global financial conditions. Why it may mislead: the 2025 disruptions are physical and persistent, not a transient logistics knot.
3. The 1970s commodity inflations. Hard assets re-rated structurally when the monetary regime shifted and real supply was constrained. Relevance: the current backdrop — elevated oil, a strong but politically contested dollar, fiscal dominance debates — rhymes. Why it may mislead: copper’s story today is more micro (geology, grades, permitting) than macro-monetary.
4. The lithium and rare-earth bottlenecks of the 2020s. Each “metal of the future” drew capital, oversupplied, and crashed. Relevance: a cautionary base rate against linear extrapolation of green-demand stories. Why it may mislead: copper has no substitute at scale in most electrical applications, a far longer supply lead time, and a vastly larger, more liquid market — it is not a thematic micro-cap commodity.
5. The current AI-capex cycle. The data-centre build-out has already pulled forward demand for power equipment, transformers and grid copper. Relevance: a genuinely new, price-inelastic demand source. Why it may mislead: AI capex is itself cyclical and could pause; the 250–550 kt of data-centre copper by 2030 is meaningful but is roughly 1–2 per cent of demand, not the whole story.
Weighing these, the cyclical analogues argue for fade-the-record caution; the structural ones argue that this record sits on a damaged supply base and a demand vector with no precedent. We set the prior probability of a US$15,000 touch within the window at 45 per cent — above a coin flip because the market is already near the line and tight, but well short of certainty because copper records have historically been sold.
The probability model — how the evidence moved it
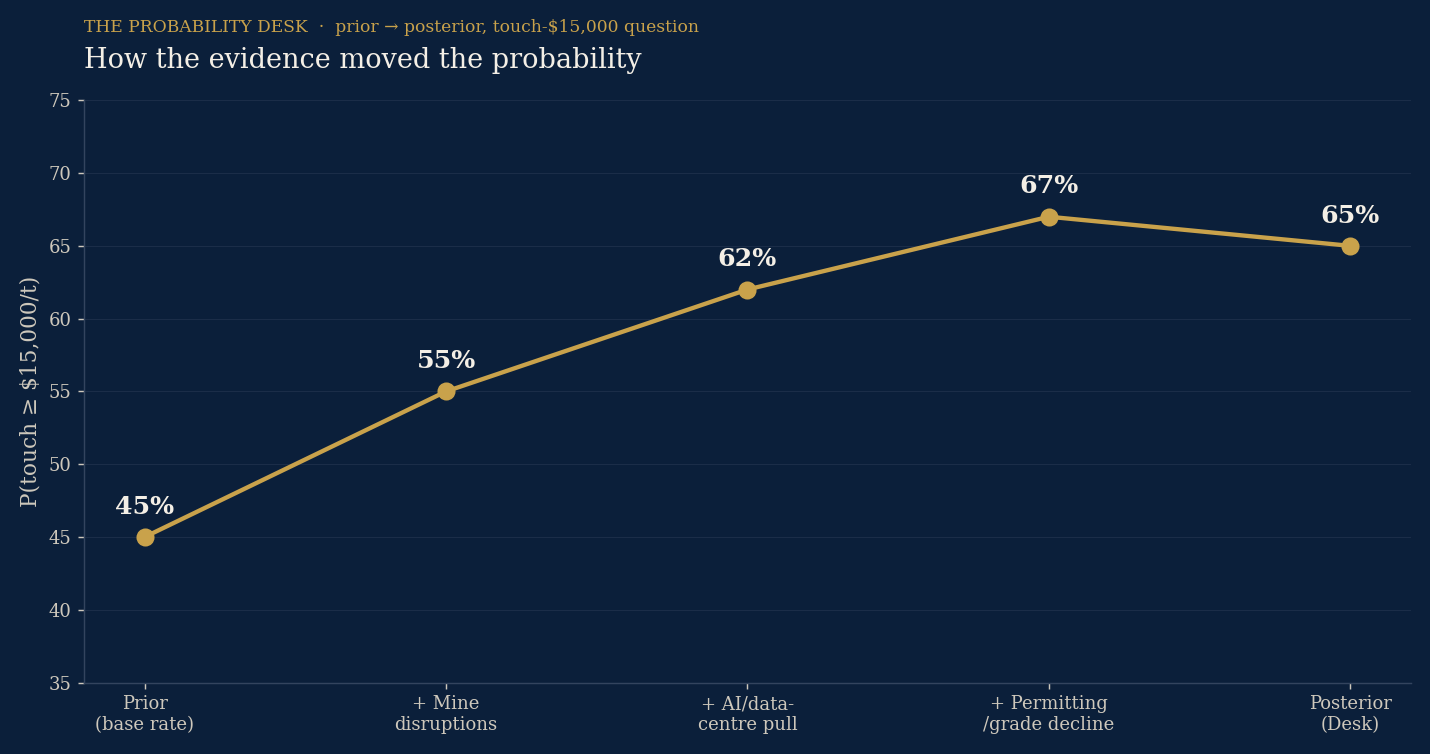
We begin at the 45 per cent prior and update on dated, sourced evidence. Each step shows the direction and the magnitude of the move; no probability is asserted without the evidence behind it.
| Evidence item | Direction | Strength | P(touch $15k) after |
|---|---|---|---|
| Prior (base rate, near-line tight market) | — | — | 45% |
| 2025 mine disruptions (Grasberg, El Teniente, Kakula) remove several hundred kt and depress 2026 output | ↑ | Strong | 55% |
| AI / data-centre + grid demand pull (IEA 250–550 kt by 2030; equipment lead times) | ↑ | Moderate | 62% |
| Structural constraints: 17-yr lead times, grades to ~0.66%, ICSG deficit flip | ↑ | Moderate | 67% |
| Counter-evidence: Goldman incentive-curve cap ~US$11k; World Bank ~US$9,800 avg; crowded long; “unsustainable” rally calls | ↓ | Moderate | 65% |
| Posterior (Desk view) | — | — | 65% |
The posterior of 65 per cent is below the level the bull-only evidence would imply because we deliberately re-weight the genuine bear case: the most authoritative price forecaster (Goldman) and the most authoritative public-sector one (World Bank) both sit materially below the current price, and a market this crowded is vulnerable to a fast unwind on any demand disappointment. The probability reflects an asymmetric, jump-prone path, not a confident march higher.
Scenarios (twelve-month horizon)
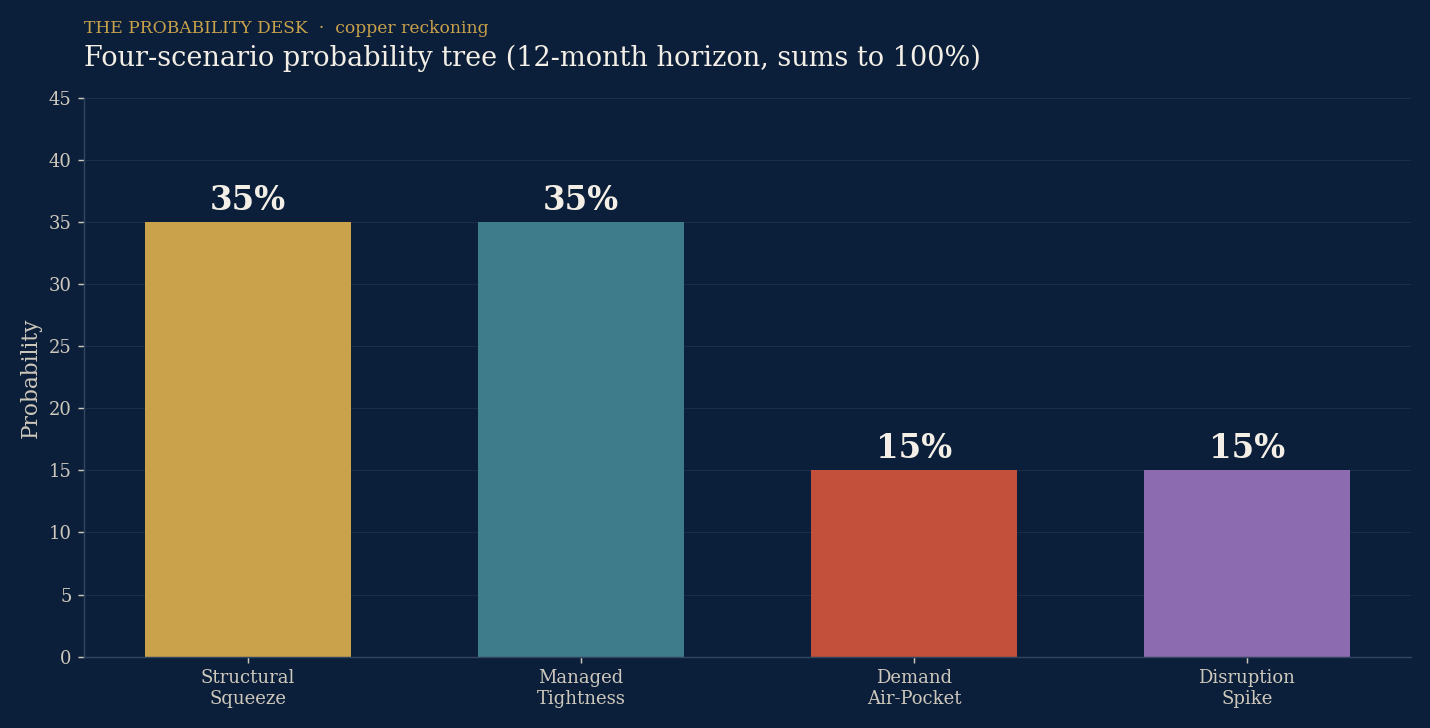
Four MECE scenarios, summing to 100 per cent.
| Scenario | Prob. | Narrative | Key trigger | Touches $15k? |
|---|---|---|---|---|
| Structural Squeeze | 35% | Deficit persists, disruptions linger, AI/grid demand holds; price grinds and spikes higher | Slow mine restarts + steady demand | Yes, comfortably |
| Managed Tightness | 35% | Tight but orderly; restarts and scrap close part of the gap; price oscillates near records without a decisive break | Partial Grasberg/El Teniente recovery | Borderline / brief touch |
| Demand Air-Pocket | 15% | Hard landing, AI-capex pause or Chinese property capitulation drains the squeeze; price falls toward incentive floor | Recession / China property | No |
| Disruption Spike | 15% | A fresh major outage or export shock removes supply abruptly; convex jump higher | New mine accident / export ban | Yes, sharply |
- Structural Squeeze (35%). Assumes the ICSG/bank deficit is realised, restarts disappoint, and the AI-plus-grid demand impulse holds. Falsified by a faster supply recovery or a demand stumble. Confidence: Moderate-High.
- Managed Tightness (35%). The base case for a market that is tight but functioning: partial restarts at the disrupted mines, scrap and substitution at the margin, and a price that lives near records without a clean break above US$15,000 except in brief episodes. Falsified by either a demand shock or a fresh outage tipping it into another scenario. Confidence: Moderate.
- Demand Air-Pocket (15%). The credible bear case. A global hard landing, an AI-capex pause, or a renewed Chinese property contraction collapses the demand side faster than supply can adjust, and the price falls toward the incentive floor near US$11,000 or below. Falsified by resilient PMIs and sustained data-centre orders. Confidence: Moderate.
- Disruption Spike (15%). The convex tail. Given the 2025 record of accidents and the concentration of supply in a handful of mega-mines and politically complex jurisdictions, a fresh shock is a live risk; it would drive a sharp, fast touch well above US$15,000. Falsified by a quiet operational year. Confidence: Moderate.
Squeeze and Disruption Spike both resolve the question YES (50 per cent combined), Managed Tightness resolves it as a brief/borderline touch in many paths, and only the Air-Pocket reliably resolves NO. That architecture is consistent with the 65 per cent posterior.
Simulation results
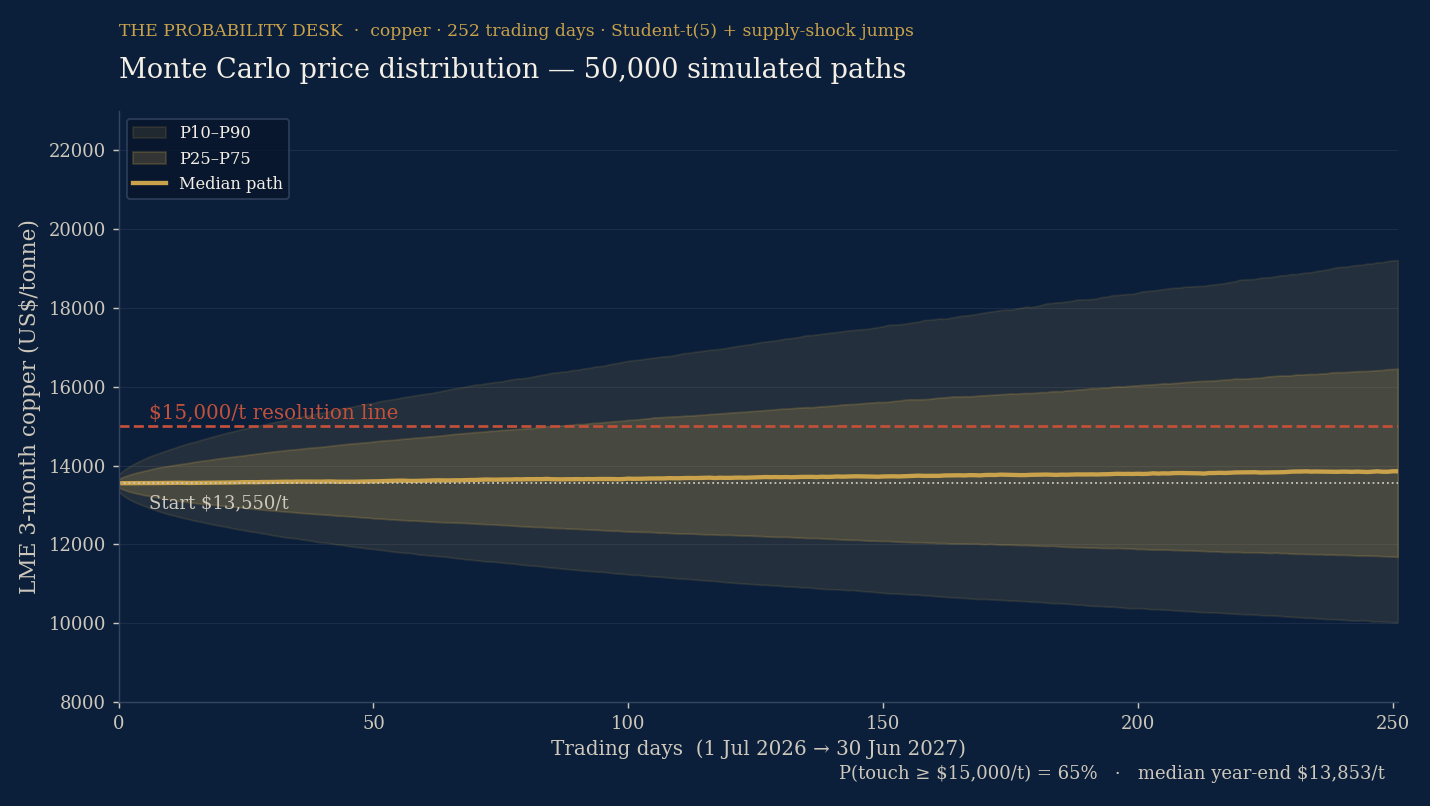
This section reports a real Monte Carlo simulation, not a designed framework. The code, assumptions and outputs are documented below.
Design. We simulate 50,000 independent price paths for the LME three-month copper contract over 252 trading days (1 Jul 2026 – 30 Jun 2027), starting from US$13,550/t. Daily log-returns combine (a) a regime-dependent drift, (b) a diffusion term with annualised volatility of 22.5 per cent and Student-t(5) standardised innovations to capture fat tails, and (c) a Poisson jump process for discrete supply/demand shocks.
Regimes (the genuine forecaster disagreement, made explicit). Each path draws one of three regimes: a tight/deficit regime (40 per cent weight, +7 per cent annual drift) reflecting the persistent-deficit, Citi-type view; a balanced regime (37 per cent weight, −8 per cent drift) reflecting Goldman’s incentive-curve cap near US$11,000; and a disruption regime (23 per cent weight, +17 per cent drift, higher jump intensity) reflecting a 2025-style outage year. Jumps are two-sided — supply shocks push the price up, demand shocks push it down — with a mild net-upside skew (roughly 62 per cent of jumps positive), reflecting the asymmetry of a deficit market.
Outputs.
| Metric | Value |
|---|---|
| P(touch ≥ US$15,000/t in window) | 65% |
| P(touch ≥ US$16,000/t) | 48% |
| P(touch ≥ US$14,000/t) | 86% |
| Median year-end price | ~US$13,850/t |
| P10 / P90 year-end | ~US$10,000 / ~US$19,200 |
| P25 / P75 year-end | ~US$11,700 / ~US$16,500 |
| P(ends below US$11,000) | 18% |
| P(ends below US$10,000) | 10% |
Main drivers. The touch probability is most sensitive to the disruption-regime weight and to the jump-skew assumption; halving the disruption weight lowers the touch probability into the high-50s, while removing the net-upside jump skew lowers it further. The year-end median is most sensitive to the balanced-regime drift, which encodes the Goldman cap.
Limitations. The model is a reduced-form price process, not a structural supply-demand balance model; it does not endogenise the COMEX-LME tariff distortion, treats volatility as constant, and uses regime weights that are judgemental (anchored to the published forecaster split but not estimated from a long copper history of comparable regimes). The fat-tailed innovations and the jump process are intended to make the distribution honest about convex risk, not to claim precision. The outputs are model outputs, not forecasts, and the disclaimer applies.
Market pricing versus the Desk view
- What looks under-priced: the tail — the convex upside from a fresh supply shock. Implied volatility and the options skew have not, in our reading, fully internalised how concentrated and accident-prone the supply base has become after 2025. The disruption tail is the cheapest part of the distribution to be wrong about.
- What looks fully priced or over-priced: the spot consensus long. Sentiment reads describe the rally as crowded and “unsustainable”; positioning is heavy; and the most rigorous price forecasters (Goldman, World Bank) sit well below the market. The base case of an uninterrupted grind higher is, in our view, over-owned.
- Highest-conviction mispricing: the gap between the structural (multi-year) supply-demand picture, which is under-appreciated by generalist allocators, and the tactical picture, which is over-traded. The Desk’s call is that the long-horizon scarcity is the durable edge; the next-twelve-months level is closer to a coin flip than the bulls believe.
- What would prove the Desk wrong: a clean, sustained break above US$15,000 driven purely by momentum with no supply catalyst (suggesting we under-weighted the demand impulse), or a collapse below US$11,000 on resilient demand data (suggesting the supply story was overstated and restarts came faster than we modelled).
Universal-owner portfolio map
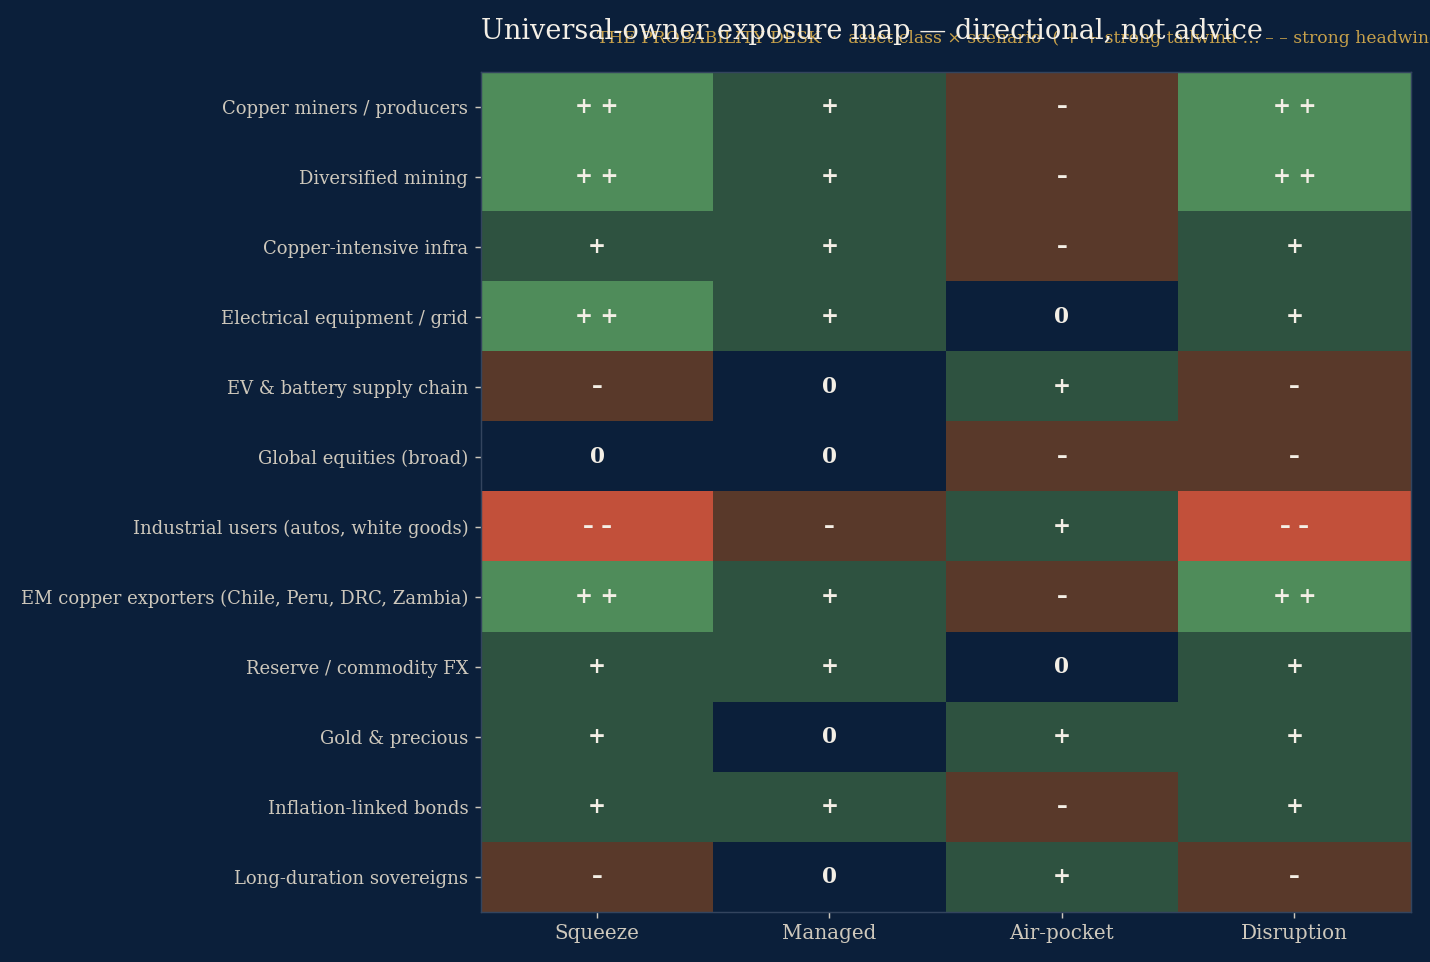
Strategic and directional, not personalised investment advice. The heatmap below scores broad asset-class exposures across the four scenarios (+ + strong tailwind … – – strong headwind).
(See visual: universal-owner exposure map.)
The through-line for an owner of the whole market: copper is not a satellite trade but a systemic input cost. A higher, more volatile copper price is a tailwind to producers, diversified miners, grid and electrical-equipment manufacturers, and the EM economies that export it (Chile, Peru, the DRC, Zambia) — and a slow, compounding headwind to copper-intensive end users (autos, appliances, construction) and, indirectly, to the cost and pace of the energy transition and the AI build-out the rest of the portfolio is implicitly long. The genuinely uncomfortable observation for a universal owner is that the portfolio is almost certainly already long copper demand through its equity, infrastructure and private-markets exposure, without owning the supply that hedges it.
Second- and third-order effects
- The energy transition gets more expensive and slower. Copper is the circulatory system of electrification; a structurally higher price raises the capital cost of grids, renewables and EVs, and at the margin slows the decarbonisation an owner’s climate commitments assume.
- AI’s physical bottleneck shifts from chips to copper-and-power. Data-centre build-outs need transformers, switchgear and cabling; copper and grid-equipment lead times become a gating constraint on the AI capex cycle that public equity valuations are pricing.
- Resource nationalism re-rates. With mine supply concentrated in Chile, Peru and the DRC — and refining even more concentrated, with China accounting for roughly 45 per cent of refined output and on track toward 50 per cent by 2040 — and demand strategic, expect more state participation, royalty renegotiation, export controls and “friend-shoring” of refining. The refining concentration in particular is a single-point-of-leverage risk that raises the political-risk premium on the entire copper supply chain, not only on EM mine exposure.
- Recycling and substitution become investable themes. Scrap, urban mining and aluminium substitution in select applications move from afterthought to capital-attracting sectors; the secondary market’s responsiveness becomes a key swing factor in the balance.
- Trade policy fragments the price. The US Section 232 regime has already split COMEX from LME; persistent regional premia, stockpiling and strategic-reserve behaviour become features, not bugs, of the market.
- EM exporter fiscal windfalls and currency effects. Sustained high copper prices improve the external accounts and fiscal space of exporter sovereigns — relevant to reserve managers and EM debt allocators.
- Inflation pass-through. As a pervasive industrial input, a durable copper re-rating feeds goods inflation at the margin, with implications for central-bank reaction functions and inflation-linked allocations.
What we’re watching
| Indicator | Why it matters | Threshold that moves the model |
|---|---|---|
| LME 3-month price | The resolution variable | Sustained break >US$15,000 or <US$11,000 |
| LME + SHFE + COMEX inventories | Real-time tightness | Combined draw to multi-year lows = bullish |
| Grasberg / El Teniente / Kakula restart timelines | Lost supply recovery | Faster restart = bearish; further delay = bullish |
| ICSG monthly balance | Neutral arbiter of deficit | Deeper deficit revision = bullish |
| Treatment & refining charges (TC/RCs) | Concentrate tightness | TC/RCs near/below zero = acute mine-supply squeeze |
| COMEX–LME premium | Tariff/flow distortion | Widening premium pulls metal to US, tightens ROW |
| China property + grid spend | Largest demand block | Property stabilisation or grid acceleration = bullish |
| Data-centre / transformer order books | New demand vector | Order acceleration = structural bullish |
| Global manufacturing PMIs | Cyclical demand | Sub-48 prints = air-pocket risk |
| Scrap availability & price spread | Supply elasticity | Scrap surge can cap upside |
| New mine FIDs & permitting decisions | Future supply | Major approvals = long-run bearish (but slow) |
| US dollar index | Priced in dollars | Sharp USD strength = headwind |
| Net speculative positioning | Crowding | Extreme net-long = unwind risk |
How this could be wrong
A disciplined red-team of our own report:
- The bull case is crowded, and we know it. If positioning is as heavy as sentiment reads suggest, a modest demand disappointment could trigger an unwind sharper than our 18 per cent “ends below US$11,000” tail implies. We have leaned against the consensus long, but a 65 per cent touch probability still sits on the bullish side of a genuinely two-sided market.
- Restarts could surprise to the upside. Grasberg, El Teniente and Kakula could recover faster than guidance; mining companies have strong incentives at these prices, and our model’s disruption-regime weight could be too high.
- Substitution and recycling are under-modelled. At a sustained US$13,500+ price, aluminium substitution and scrap supply respond more than a reduced-form price model captures; the structural gap may be smaller in practice than the IEA’s physical scenarios imply.
- The COMEX-LME split muddies “the” price. Our resolution variable is the LME; a US-centric tariff shock could send COMEX to records while LME lags, or vice versa.
- The 25-year demand path is a scenario, not a certainty. Net-zero demand of ~40 Mt assumes policy follow-through that may not arrive; a slower transition lowers the structural pull.
- Regime weights are judgemental. They are anchored to the published forecaster split, not estimated from a long history of comparable copper regimes; reasonable analysts would choose different weights and reach a touch probability anywhere from the high-50s to the low-70s.
On balance, the report would be wrong fastest if a demand air-pocket arrived before any fresh supply shock — the one sequence in which a crowded, richly-priced market has little cushion.
Methodology box
The