
Patriotic Capital — the cinematic companion to this report. Six minutes.
The Closed Strait: How Long Should Capital Plan for a Disrupted Hormuz?
Executive summary
The Strait of Hormuz — the single most important chokepoint in the global energy system, carrying roughly 20 million barrels a day, about a fifth of world petroleum-liquids consumption — has been materially disrupted since late February 2026. The waterway was effectively shut for 55 days between 1 March and 24 April, with observed crossings down more than 90% versus pre-war levels, the longest sustained closure in its modern history. On 1 May the United Arab Emirates formally left OPEC and OPEC+, removing a swing producer and thinning the cartel's coordinated spare capacity at the worst possible moment. Brent crude, which traded near the high-$70s before the conflict, ran to $116.73 on 18 May (the latest hard reading from the FRED daily series) and was changing hands around $100 on 26 May as a US–Iran ceasefire framework advanced.
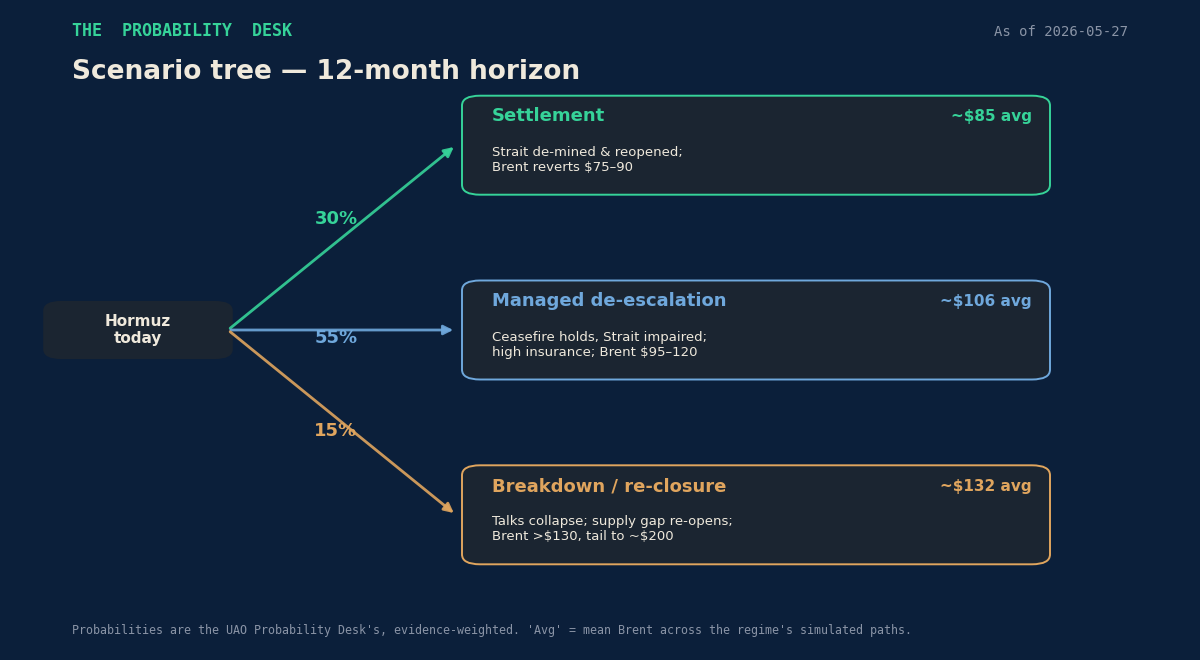
The central question for a universal owner is not "where is oil tomorrow" but how long should capital plan for a disrupted Strait, and what reprices if the disruption persists. The Probability Desk's evidence-weighted view assigns 30% to a clean settlement (Strait de-mined and reopened, Brent reverting toward the high-$70s to $90), 55% to a managed de-escalation (a fragile ceasefire holds but the Strait runs impaired behind convoys and punitive war-risk insurance, Brent ranging $95–120), and 15% to a breakdown (talks collapse, the supply gap re-opens, Brent above $130 with a tail toward $200).
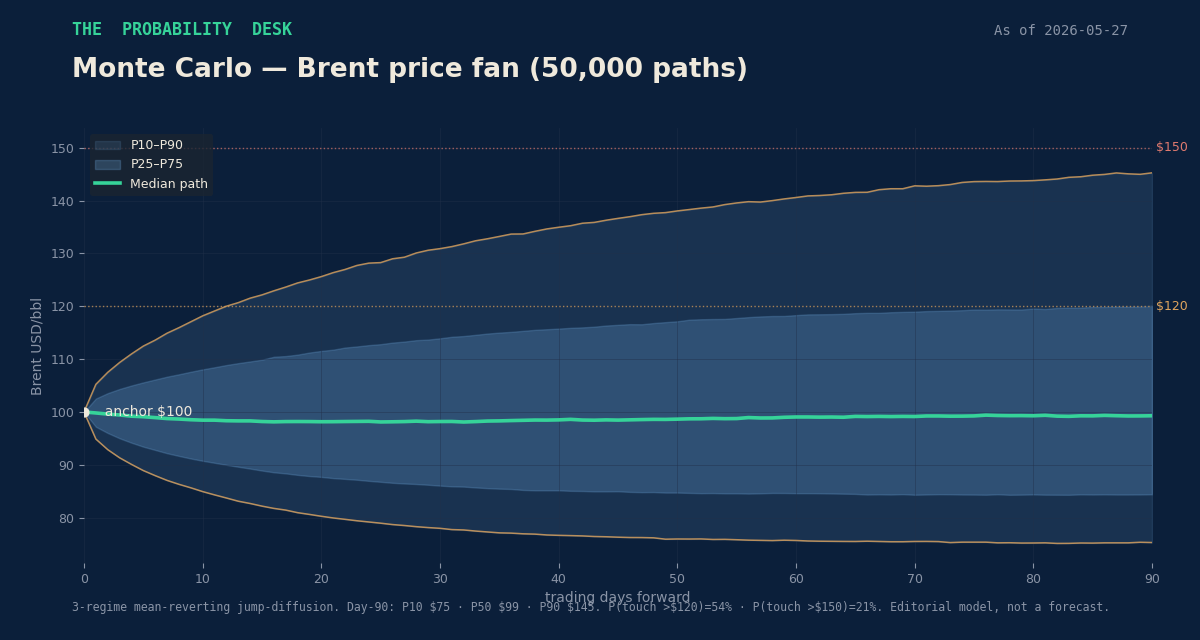
A 50,000-path Monte Carlo built on those regime weights puts the median average Brent over the next ~4.5 months at roughly $100, with a wide cone: a 10th percentile near $81 and a 90th near $129 on the horizon average, and a day-90 distribution spanning $75 (P10) to $145 (P90). The model implies a ~54% chance Brent touches $120 at some point over the window and a ~21% chance it touches $150.
Our highest-conviction call is not directional on the spot price — which sits roughly where the market and the EIA already have it — but structural: the market is pricing a return to normal that under-weights the persistence of the risk premium. War-risk insurance, bypass-pipeline capital expenditure, the erosion of OPEC spare capacity after the UAE's exit, and a re-closure tail that does not disappear the day mines are cleared together argue for a durably higher cost of energy security embedded in the cost of capital, in shipping, and in the strategic value of barrels that never touch Hormuz. That premium is the asset universal owners are being asked to price.
The Desk View, in one paragraph
The market has largely chosen the optimistic branch — Brent has faded from $117 to $100 on the ceasefire framework — but a 55-day physical closure, a chokepoint with no viable alternative for most of its 20 mb/d, a war-risk insurance market that has repriced 12–32x and will demand months of calm before relenting, and an OPEC whose spare-capacity buffer just shrank with the UAE's departure do not unwind on a press release. The Desk reads the balance of evidence as a muddle-through (55%) rather than a clean exit (30%), with a non-trivial breakdown tail (15%) that the forward curve under-rewards. For a universal owner, the actionable insight is to treat the energy-security premium as structural rather than episodic, and to value non-Hormuz optionality — Saudi and UAE bypass routes, strategic storage, domestic supply, and inflation protection — as more valuable than the consensus implies.
Situation as of today (27 May 2026)
A US–Israeli air campaign against Iran began on 28 February 2026; Iran responded by interdicting traffic through the Strait of Hormuz, and observed crossings collapsed by more than 90%. Gulf producers — Iraq, Saudi Arabia, Kuwait, the UAE, Qatar and Bahrain — collectively shut in roughly 10.5 mb/d of crude in April as buyers could not lift cargoes. A fragile ceasefire has held since 8 April, punctuated by skirmishes over the waterway.
On 23 May, the US president said a deal to reopen the Strait was "largely negotiated." On 24 May, the two sides reached a framework extending the ceasefire 60 days while the Strait is de-mined and reopened, with a memorandum of understanding as a first phase and broader talks within 30–60 days. Significant disagreements remain over control of the Strait (Iran maintains it stays under Iranian management and publicly dismissed the reopening claim as "incomplete"), Iran's nuclear program and enriched-uranium stockpile, frozen assets, and the timing of sanctions relief. The diplomatic path is real but unfinished — which is precisely why a probability distribution, not a point forecast, is the honest representation.
What changed
Three structural shifts distinguish this episode from prior chokepoint scares. First, the disruption was physical and sustained — a 55-day closure, not a one-day headline — removing more barrels from accessible supply than the 1973 embargo or the 1979 revolution on the Desk's reading of the available estimates. Second, the UAE left OPEC on 1 May, removing a ~4.8 mb/d producer from the coordinating group and helping push the IEA's expected 2027 OPEC spare capacity down to roughly 2.5 mb/d from a prior ~3.8 mb/d. Third, the insurance and shipping market repriced the risk independently of the spot: war-risk premiums moved from ~0.25% of hull value to 3–8%, and that premium will persist even after a reopening because insurers want months of demonstrated stability. The combination means the cost of moving Gulf energy is structurally higher even in the benign scenarios.
Source Ledger
The model is built only on attributable, dated sources. Confidence is High/Medium/Low. "Moves model?" flags whether the data point shifts a probability or a price node.
| # | Source | Date | Data point | Conf. | Moves model? |
|---|---|---|---|---|---|
| 1 | EIA, Short-Term Energy Outlook | May 2026 | FY2026 Brent $94.85; Q2 $109.73, Q3 $99.09, Q4 $89.00; 2027 $79.39; Strait "effectively closed until late May"; +$20/bbl if reopening slips a month | H | Yes |
| 2 | EIA, Today in Energy (Hormuz chokepoint) | 2026 | ~20.3 mb/d transit in 2024 ≈ 20% of global petroleum-liquids consumption; ~25% of seaborne oil trade | H | Yes |
| 3 | EIA, Today in Energy (LNG) | 2026 | >10 Bcf/d LNG disrupted (~20% of traded LNG); TTF +35% to $14.80, JKM +51% to $16.02/MMBtu | H | Yes |
| 4 | IEA, Strait of Hormuz factsheet | Feb 2026 | No viable alternative sea route; OPEC spare capacity geographically trapped behind the chokepoint | H | Yes |
| 5 | Oxford Institute for Energy Studies, Insight 181: The Anatomy of the Strait of Hormuz Oil Shock | Apr 2026 | 55-day effective closure (1 Mar–24 Apr); crossings −90%; ~10.5 mb/d Gulf shut-ins in April | H | Yes |
| 6 | Kpler, Middle East conflict oil-market assessment | 5 Mar 2026 | Real-time transit/flow collapse; flow-recovery tracking | H | Yes |
| 7 | FRED, Brent crude daily reference series | 18 May 2026 | Brent spot $116.73 (latest feed obs; series lags ~1 week) | H | Yes |
| 8 | FRED, WTI crude daily reference series | 18 May 2026 | WTI spot $112.25 | H | Yes |
| 9 | CNBC, oil markets | 26 May 2026 | Brent ~$99.58–$100 (futures) after Iran retaliation vow; off the mid-May peak | H | Yes |
| 10 | CNBC / Washington Post / CNN / Al Jazeera | 23–24 May 2026 | US–Iran framework: 60-day ceasefire extension; Strait to be de-mined and reopened; control/nuclear/assets unresolved | H | Yes |
| 11 | Al Jazeera / CNBC / Khaleej Times | 28–29 Apr 2026 | UAE withdraws from OPEC/OPEC+ effective 1 May; capacity ~4.8 mb/d | H | Yes |
| 12 | IEA / Kpler | 2026 | OPEC spare capacity >4 mb/d in Q4 2025 → ~2.5 mb/d expected 2027 post-UAE | H | Yes |
| 13 | Wikipedia, East–West Crude Oil Pipeline / Pipeline Technology Journal | 2026 | Saudi Petroline ~5 mb/d normal, up to 7 mb/d with NGL conversion; ~2 mb/d used → 3–5 mb/d spare | H | Yes |
| 14 | CNBC / Al Jazeera | 12 Mar / 15 May 2026 | UAE Habshan–Fujairah (ADCOP) ~1.5–1.8 mb/d; UAE accelerating the bypass project; combined bypass ~3.5–5.5 mb/d vs ~20 mb/d transit | H | Yes |
| 15 | Caixin / Strauss Center / Khaleej Times | Mar–May 2026 | War-risk insurance 0.25% → 3–8% of hull value ($3–8m/transit); stays elevated post-reopening | H | Yes |
| 16 | Safety4Sea | 2026 | VLCC charters $538,000–$770,000/day | H | Yes |
| 17 | EIA / Kpler / Arab Reform Initiative | Mar 2026 | ~93% of Qatar's, ~96% of UAE's LNG transited Hormuz; QatarEnergy force majeure 4 Mar; ~120 bcm cumulative LNG loss 2026–30 | H | Yes |
| 18 | Barclays (via STEO coverage) | May 2026 | FY2026 Brent $100 (from $85); supply deficit ~6.6 mb/d | H | Yes |
| 19 | UBS (via crisis coverage) | Apr–May 2026 | Global inventories −246 mb in Mar+Apr; cumulative production losses could exceed 1bn barrels by end-May | M | Yes |
| 20 | EIA STEO | May 2026 | Q2 2026 global inventory draw averaging 8.5 mb/d | H | Yes |
| 21 | Investing News Network / Fed coverage | Mar 2026 | Fed held policy rate at 3.50–3.75% citing energy-price uncertainty; June cut "a non-starter" | M | Yes |
| 22 | CNBC / Trading Economics | early May 2026 | Gold ~$4,700/oz; reportedly ~13% lower since the conflict began as energy-inflation/tighter-policy fears capped it | M | Partial |
| 23 | CRS / Congress.gov (R45281) | 2026 | Iran conflict & Hormuz: oil, gas, commodity transmission channels | H | Context |
| 24 | Britannica / Statista | 2024–26 | Hormuz oil-flow history and chokepoint share | H | Context |
| 25 | German Economic Institute (IW) | 2026 | Why the 2026 Hormuz shock may not enrich the Gulf (demand-destruction channel) | M | Context |
| 26 | LSE Business Review | 12 Mar 2026 | Hormuz as a combined inflation/shipping/growth shock | M | Context |
| 27 | House of Commons Library (CBP-10637) | 2026 | US–Iran ceasefire & nuclear-talks status | M | Context |
| 28 | The Conversation | 2026 | Gulf bypass alternatives and their limits | M | Context |
(Full URLs in the appendix.)
Key data table
| Variable | Current reading | Prior / pre-conflict | Direction | Source | Conf. |
|---|---|---|---|---|---|
| Brent spot (FRED) | $116.73 (18 May) | high-$70s | ↑↑ | FRED | H |
| Brent (market, late May) | ~$100 (26 May) | — | ↓ from peak | CNBC | H |
| WTI spot (FRED) | $112.25 (18 May) | low-$70s | ↑↑ | FRED | H |
| EIA Brent, FY2026 | $94.85 | $78.84 (pre) | ↑ | EIA STEO | H |
| Hormuz transit | ~20 mb/d (≈20% of liquids demand) | ~20 mb/d | chokepoint | EIA/IEA | H |
| Closure duration to date | 55 days (1 Mar–24 Apr); crossings −90% | 0 | extreme | Oxford/Kpler | H |
| Gulf shut-ins (April) | ~10.5 mb/d | 0 | extreme | Oxford | H |
| OPEC spare capacity (2027E) | ~2.5 mb/d | ~3.8 mb/d | ↓ | IEA/Kpler | H |
| Bypass capacity (Saudi+UAE) | ~3.5–5.5 mb/d | similar | insufficient vs 20 | CNBC | H |
| War-risk insurance | 3–8% of hull ($3–8m/transit) | ~0.25% | ↑↑↑ | Caixin/Strauss | H |
| VLCC day rate | $0.54–0.77m/day | tens of thousands | ↑↑↑ | Safety4Sea | H |
| TTF / JKM gas | $14.80 / $16.02 MMBtu | lower | ↑ | EIA | H |
| US 10-year yield (FRED) | 4.56% (22 May) | — | flat-to-up | FRED | H |
| Fed policy rate | 3.50–3.75% (held Mar) | cutting late-25 | paused | INN | M |
| Gold | ~$4,700/oz | lower | ↑ trend | TE | M |
Forecast question
Primary (resolvable): Over the ~4.5-month tactical window from 27 May 2026, what is the distribution of the average Brent spot price, and over the 12 months to end-May 2027, what is the probability the Strait of Hormuz suffers ≥14 cumulative days of renewed material throughput impairment (observed crossings below 50% of pre-war normal)?
Horizon: tactical 3–4.5 months for price; strategic 12 months for disruption. Resolution criteria: Brent average from the FRED Brent crude daily reference series daily series; disruption days from IEA/Kpler/Vortexa crossing data. Base rate: chokepoint scares since 1973 have usually round-tripped within weeks (Abqaiq 2019, Red Sea 2024); a sustained multi-week physical closure at this scale has no clean modern precedent — the 55-day closure already exceeds every prior episode in barrels removed. What would change the call: completion of de-mining and a sustained return of crossings above ~70% of normal (toward settlement); a collapse of the 60-day framework or a renewed mining/strike event (toward breakdown).
Prior and analogues
| Analogue | Why relevant | Why possibly misleading | Implication for the prior |
|---|---|---|---|
| 1973 Arab oil embargo | Politically-driven supply cut; price ~4x | Embargo, not a physical chokepoint closure; different demand elasticity | Persistent shocks can quadruple price but demand destruction follows |
| 1979 Iranian Revolution | ~5–6% of global supply lost; Iran-centred | Gradual; no Strait closure | Iran-supply shocks are durable, not one-day |
| 1980–88 "Tanker War" | 450+ ships hit in the Gulf; closest precedent for sustained Hormuz risk | The Strait never fully closed; flows continued under risk | Markets can function under chronic risk — at a permanent premium |
| 1990 Gulf War | Spike then fade as Saudi spare capacity filled the gap | Ample spare capacity then; far less now | The 2026 buffer is thinner — fade is less assured |
| 2019 Abqaiq | 5.7 mb/d offline; +15% then round-tripped in weeks | Rapid Saudi repair; no chokepoint closure | Chokepoint scares often mean-revert fast — the optimistic anchor |
| 2024 Red Sea / Houthi | Rerouting, higher freight, no sustained crude spike | Suez is reroutable; Hormuz is not | Reroutability is the key difference — Hormuz has none |
The honest reading: the base rate says "it usually round-trips," which is why a naive chokepoint prior would put the most weight on a clean settlement. But the two analogues that round-tripped fastest (Abqaiq, Red Sea) did not involve a multi-week physical closure of an unreroutable strait, and the one structurally closest precedent (the Tanker War) resolved into chronic risk at a permanent premium rather than a clean return to the prior world.
Probability model and how the evidence moved it
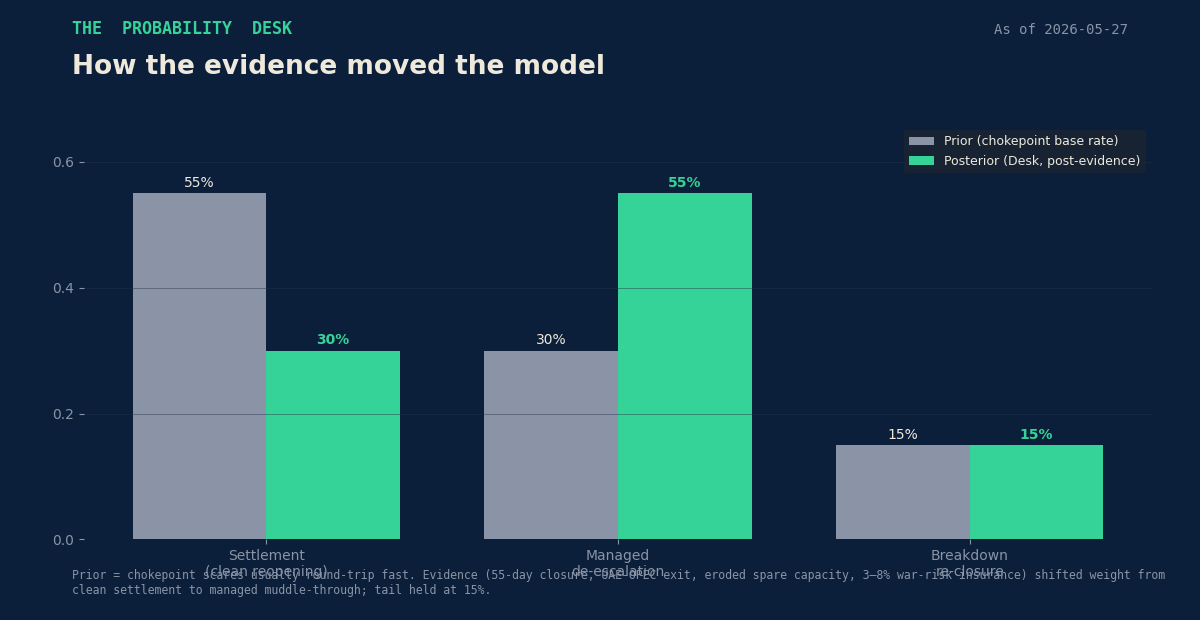
A naive chokepoint prior — "these scares round-trip" — would weight Settlement 55% / Managed 30% / Breakdown 15%. The Desk updates that prior on the specific evidence of this episode and arrives at a posterior of Settlement 30% / Managed 55% / Breakdown 15%. The weight that moved did not go to the tail; it moved from clean exit to managed muddle-through, because the evidence points to a disruption that is real, physical and structurally sticky even as the diplomatic path opens.
Evidence-update table (no probability is published here without the evidence that moved it):
| Evidence item | Direction | Strength | Effect on regime weights |
|---|---|---|---|
| 55-day physical closure; crossings −90% | ↑ persistence | High | Shifts weight Settlement → Managed |
| US–Iran 60-day framework + de-mining (24 May) | ↑ de-escalation | High | Caps the Breakdown tail; supports Settlement & Managed |
| Iran disputes Strait "control"; nuclear unresolved | ↑ fragility | Medium | Holds Breakdown at 15%; tempers Settlement |
| War-risk insurance 3–8%, sticky post-reopening | ↑ persistence | High | Reinforces Managed over Settlement |
| UAE exits OPEC; spare capacity → ~2.5 mb/d | ↑ supply fragility | High | Raises Managed/Breakdown price targets |
| Bypass only 3.5–5.5 vs 20 mb/d | ↑ severity if closed | High | Raises Breakdown price target |
| Brent faded $117 → $100 on the framework | market prices de-escalation | Medium | Confirms market's Settlement lean — the Desk's contrarian gap |
The Desk's distinctive position: the market is leaning toward Settlement (the price fade, the EIA's late-May reopening assumption), while the balance of structural evidence leans toward Managed. That gap — not a dramatic directional call — is the report's edge.
Scenarios
| Scenario | Prob. | Brent (regime avg) | Narrative | Key triggers | What falsifies it |
|---|---|---|---|---|---|
| Settlement (clean reopening) | 30% | ~$85 | Framework holds; Strait de-mined and reopened; crossings recover above 70% of normal within weeks; Brent reverts toward the EIA path (high-$70s–$90) | De-mining completed; insurance relents; sanctions-relief sequencing agreed | Crossings stall below 50%; insurance stays >3%; a renewed mining/strike event |
| Managed de-escalation (base) | 55% | ~$106 | Ceasefire holds but the Strait runs impaired behind convoys and 3–8% war-risk insurance; intermittent skirmishes; Brent ranges $95–120; normalization drags into late 2026/2027 (per EIA) | Partial reopening but sticky insurance; bypass maxed; spare capacity thin | A clean, durable reopening (→ Settlement) or a framework collapse (→ Breakdown) |
| Breakdown / re-closure | 15% | ~$132 (tail to ~$200) | 60-day framework collapses; Strait re-closes or is contested; the ~20 mb/d gap re-opens against 3.5–5.5 mb/d of bypass; Brent above $130 with a fat upside tail | Nuclear/control impasse; a kinetic incident; Iranian re-interdiction | A signed, enforced agreement with crossings normalizing |
Simulation — results
The Desk ran a real Monte Carlo of 50,000 paths (numpy; fixed seed 20260527), a 3-regime mean-reverting jump-diffusion over a 90-trading-day (~4.5-month) horizon, anchored to the latest market spot (~$100). Each path is assigned one regime by the posterior weights above; within a regime the price mean-reverts toward a regime "fair-value" target drawn from a distribution (Settlement ~N($82,7), Managed ~N($108,10), Breakdown ~N($150,25)), with crisis-scaled daily volatility (≈48/63/87% annualized) and Poisson headline jumps (positive in the impaired regimes, negative relief gaps in Settlement). A separate draw assigns forward disruption duration. Full parameters are in the Methodology Box; the code is reproducible.
Brent — average over the horizon: P10 $81 · P25 $88 · P50 $100 · P75 $114 · P90 $129 (mean $103.5). Brent — day-90 level: P10 $75 · P25 $84 · P50 $99 · P75 $120 · P90 $145. Threshold probabilities: P(Brent touches $120 over the window) ≈ 54%; P(touches $150) ≈ 21%; P(day-90 below $85) ≈ 26%; P(day-90 above $120) ≈ 25%. Forward disruption (12 months): material-impairment days — P50 24 · P90 93; P(≥14 cumulative impairment days) ≈ 68%; P(≥60 days) ≈ 20%.
The fan illustrates the asymmetry that matters for a long-horizon owner: the median sits near the current spot, but the upper tail is fat and the downside is bounded by the EIA-anchored reversion. The distribution is the Desk's, conditioned on the posterior regime weights; it is an editorial model, not a forecast of fact, and it is only as good as those weights — which is why the evidence that set them is shown above.
Market pricing vs. the Desk view
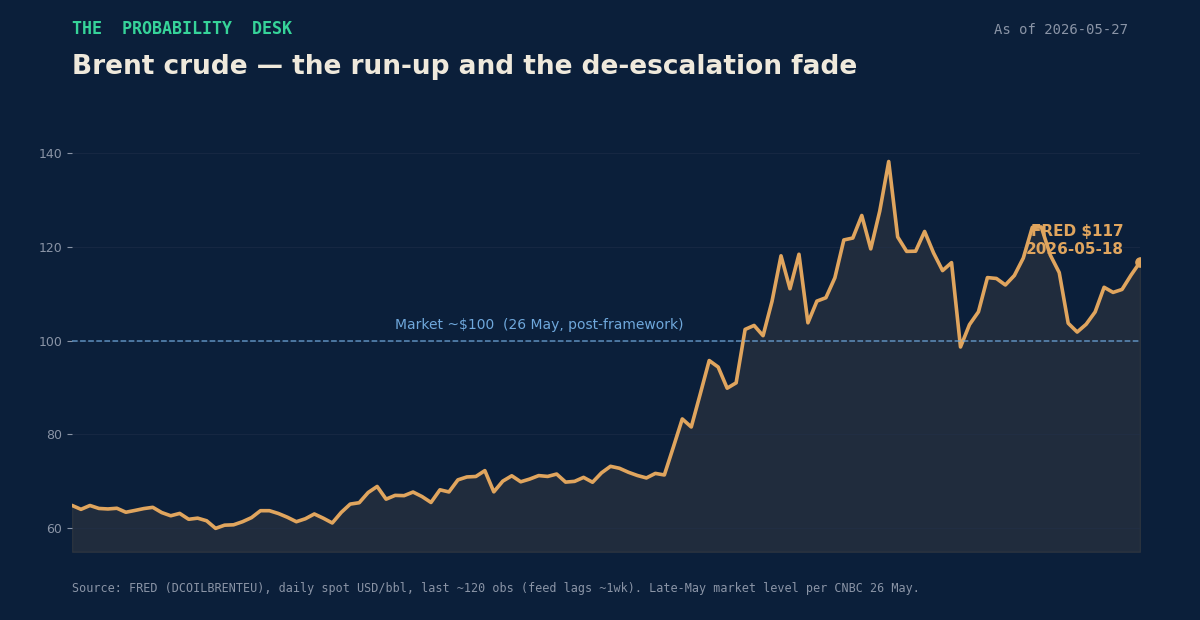
The spot has faded from $117 (18 May) to ~$100 (26 May); the EIA's May STEO assumes the Strait reopens from June and sees FY2026 Brent at $94.85; Barclays sits at $100. On the point price, the Desk is not far from consensus — our median average (~$100) sits right on the market.
Where the Desk differs is on what the curve under-rewards:
- Underpriced: the persistence of the war-risk insurance premium (3–8%, sticky for months), the re-closure tail (a ~21% chance Brent touches $150 that a fading spot obscures), the structural loss of OPEC spare-capacity buffer after the UAE's exit, and the strategic value of non-Hormuz barrels and bypass capacity.
- Overpriced: the speed of normalization implied by the spot fade — the EIA itself expects pre-conflict trade patterns to take until late 2026/early 2027 to return, and insurers will demand months of calm before relenting.
- Highest-conviction mispricing: the energy-security premium in the cost of capital — markets are treating this as an episode to be faded; the Desk treats it as a structural re-rating of chokepoint risk.
- What would prove the Desk wrong: a clean, enforced agreement with crossings durably above 70% of normal and insurance falling below ~1% within the quarter — in which case Settlement (currently 30%) is too low and the spot should converge to the high-$70s faster than our model allows.
Universal-owner portfolio map
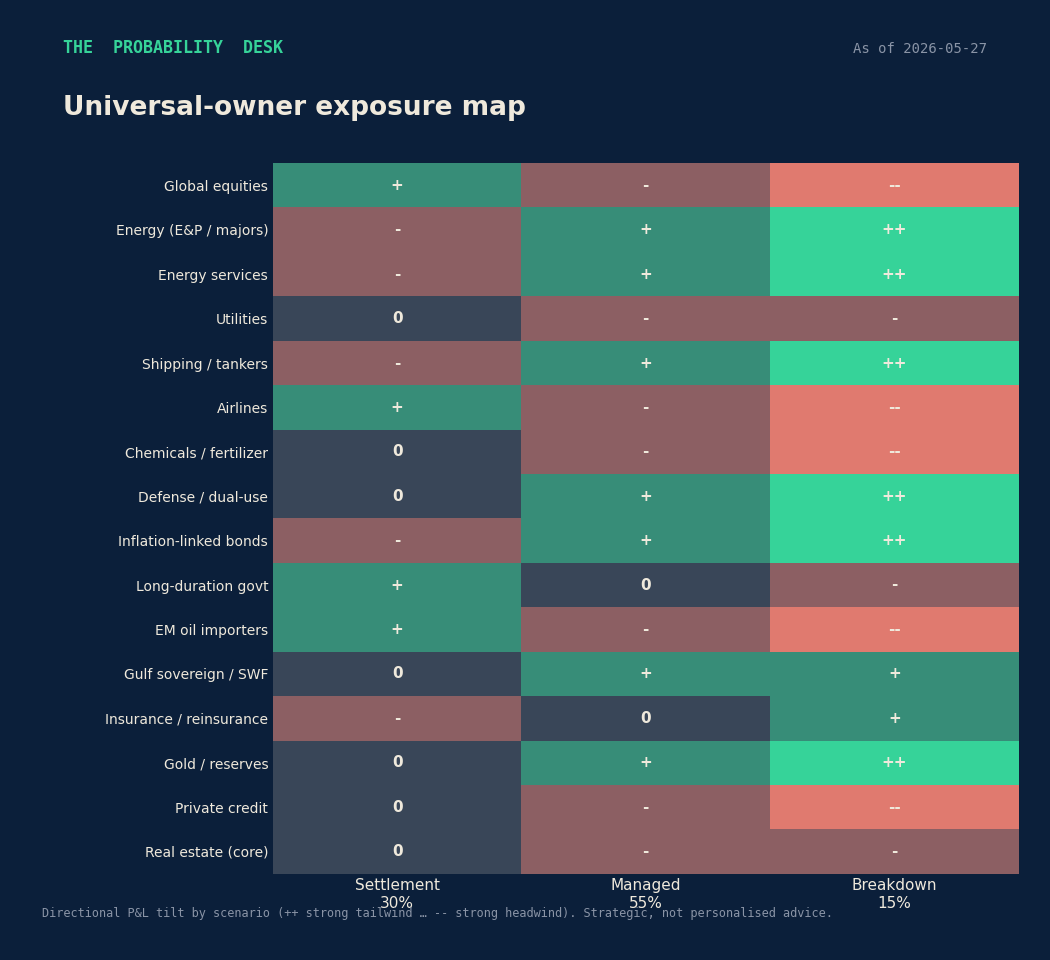
Strategic, not personalized advice. The heatmap scores the directional P&L tilt of each asset class under each scenario. The signal for a universal owner is convexity: the assets that are hurt in Breakdown (global equities, airlines, EM oil importers, core real estate, private credit) are precisely those a diversified owner already holds in size, while the assets that pay off in Breakdown (energy, energy services, shipping, defense/dual-use, inflation-linked bonds, gold, and Gulf sovereign exposure) are the natural hedges. The question is not "call the scenario" but "is the portfolio's energy-security convexity priced for a 15% tail and a 55% muddle-through" — which, on the Desk's reading, it is not.
Second- and third-order effects
The first-order effect is the oil price. The durable effects are downstream. Exporter fiscal behavior: Gulf producers with bypass capacity (Saudi Arabia's Petroline, the UAE's Fujairah route) gain strategic leverage and an incentive to accelerate bypass capex — the UAE is already fast-tracking its project. Spare-capacity erosion: the UAE's OPEC exit lowers the coordinated buffer to ~2.5 mb/d, making every future disruption more price-sensitive. Gas and the demand side: with ~93% of Qatar's LNG routed through Hormuz and QatarEnergy under force majeure, TTF and JKM have jumped 35–51%, exporting an industrial-cost shock to Europe and a contracting shock to Asia, and delaying the global LNG supply wave by years (~120 bcm cumulative loss to 2030). Inflation and central banks: the Fed has paused at 3.50–3.75% explicitly citing energy-price uncertainty, and a sustained shock complicates the disinflation path everywhere — a higher-for-longer rate environment repriced through long-duration and private-market valuations. Insurance and payment rails: war-risk exclusions and convoy requirements raise the structural cost of Gulf trade; strategic storage and regionalization of supply chains gain value; Global-South importers with thin FX buffers are the most vulnerable. For a universal owner, the through-line is that a chokepoint event becomes a multi-year repricing of energy security, inflation risk, and the strategic premium on supply that does not depend on a single waterway.
What we're watching
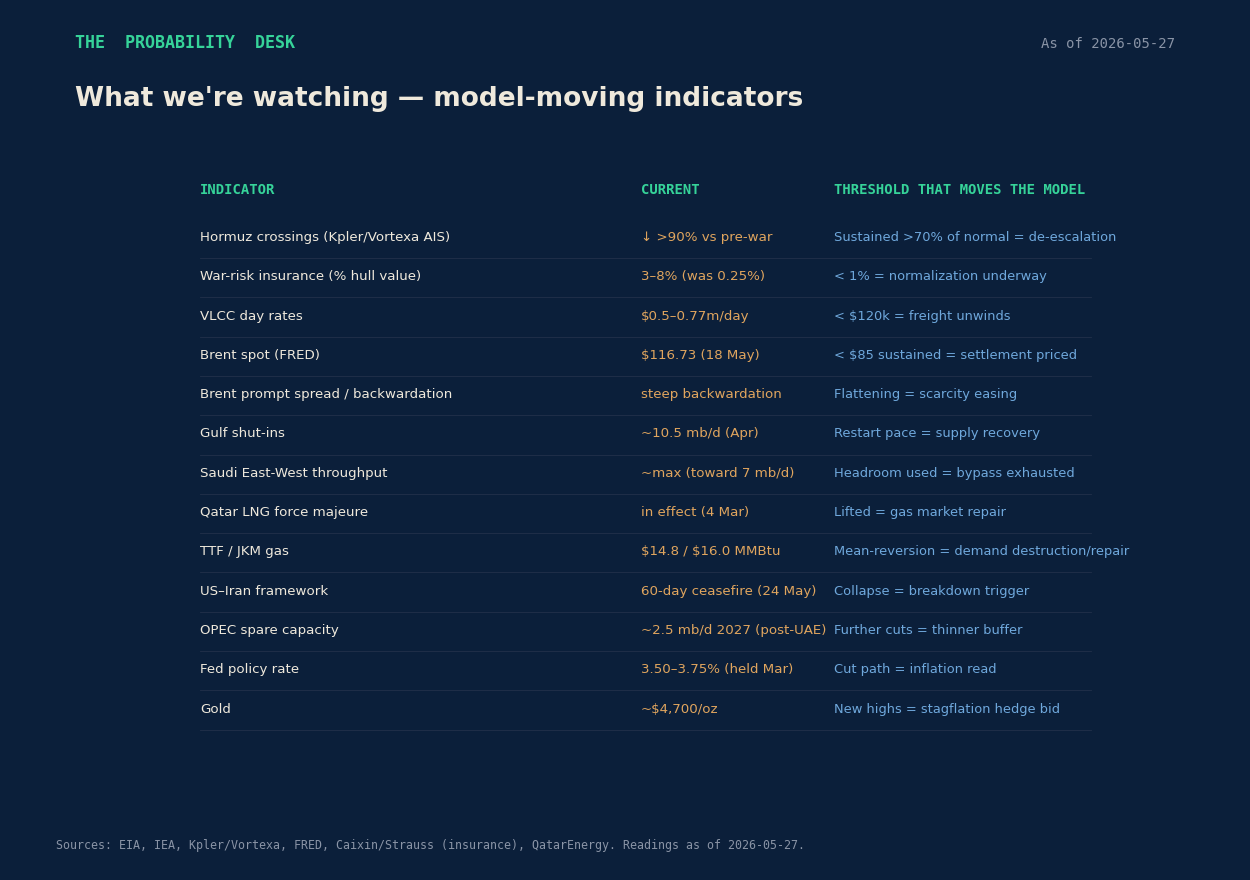
The dashboard lists the measurable indicators that would move the model and the thresholds that flip a regime. The two that matter most: Hormuz crossings sustained above ~70% of normal (the cleanest signal toward Settlement) and the survival of the 60-day framework (its collapse is the Breakdown trigger). War-risk insurance falling below ~1% would confirm normalization; a flattening of Brent's backwardation would confirm scarcity easing.
Visual appendix
- Brent price chart (live FRED) — the run-up and the de-escalation fade.
- Scenario tree — the three regimes and their average prices.
- Prior → posterior — how the evidence moved the model.
- Monte Carlo fan — 50,000-path Brent distribution with $120/$150 thresholds.
- Universal-owner exposure heatmap — asset classes × scenarios.
- Watch dashboard — model-moving indicators and thresholds.
- One-page infographic (LinkedIn).
- Hero (editorial).
Red team — how this could be wrong
The Desk's posterior could be wrong in three identifiable ways. First, the Managed weight (55%) may be too high. If de-mining is faster and insurance relents quicker than the structurally-sticky-premium thesis assumes, the market's Settlement lean is right and the Desk is anchoring on persistence that does not materialize — Abqaiq and the Red Sea both round-tripped faster than the bears expected. Second, the regime fair-value targets are calibrated to the EIA path and bank views, which themselves embed a reopening assumption; if that consensus is collectively wrong in either direction, the fan is mis-centered. Third, the breakdown tail (15%) is a judgment, not a measured frequency — there is no clean base rate for "a 60-day US–Iran ceasefire framework collapsing into Strait re-closure," so this number carries genuine model risk. The simulation is a structural model with assumed distributions and correlations, not a fitted statistical forecast; its percentiles describe the model's assumptions, not the world. The weakest single assumption is the durability of the war-risk insurance premium, which drives much of the Managed-over-Settlement tilt; if insurers re-rate down within weeks of a reopening, the Desk should move weight back to Settlement. What could make this wrong by tomorrow: a signed, enforceable agreement that normalizes crossings (→ Settlement) or a kinetic incident in the Strait (→ Breakdown).
Methodology box
Model: 3-regime mean-reverting jump-diffusion, 50,000 Monte Carlo paths, 90 trading days, anchored at $100 (latest market Brent, 26 May; FRED feed $116.73 on 18 May). Regime weights (posterior): Settlement 0.30, Managed 0.55, Breakdown 0.15. Regime fair-value targets (USD/bbl, drawn per path): Settlement N(82,7), Managed N(108,10), Breakdown N(150,25), clipped [35,260]. Daily reversion speed κ = 0.060/0.030/0.018; daily volatility σ = 3.0%/4.0%/5.5% (≈48/63/87% annualized). Poisson headline jumps: intensity 0.015/0.030/0.060 per day; mean jump −2.0%/+1.2%/+3.0%. Forward disruption duration drawn lognormally per regime, clipped to [0,365] days. Seed 20260527; reproducible. Data: live values from the Probability Desk macro data feed (FRED's daily reference series for Brent crude, WTI crude, and the US 10-year Treasury yield); event and structural figures from the Source Ledger. Probabilities are the UAO Probability Desk's, evidence-weighted per the methodology in the Probability Desk playbook; they are editorial estimates, not measured frequencies. Calibration: this report's resolvable forecast question will be scored (Brier) against the FRED Brent average and IEA/Kpler crossing data at horizon.
Disclaimer
This report is for informational and research purposes only and does not constitute investment, legal, tax, or financial advice. Editorial scenario analysis only — not investment, actuarial, or geopolitical advice. Probabilities are the UAO Probability Desk's own evidence-weighted estimates. Live data is sourced from public feeds (FRED) and cited third parties; figures are as of 27 May 2026 and the feed dates noted.
Source URLs
EIA STEO: https://www.eia.gov/outlooks/steo/ · EIA press release 12 May 2026: https://www.eia.gov/pressroom/releases/press588.php · EIA Hormuz chokepoint: https://www.eia.gov/todayinenergy/detail.php?id=65504 · EIA LNG: https://www.eia.gov/todayinenergy/detail.php?id=67604 · IEA Hormuz factsheet: https://iea.blob.core.windows.net/assets/c8248eba-8689-46d9-ae4b-b858b59c0f1c/StraitofHormuz2026-Factsheet.pdf · IEA oil security: https://www.iea.org/about/oil-security-and-emergency-response/strait-of-hormuz · Oxford Energy Insight 181: https://www.oxfordenergy.org/wpcms/wp-content/uploads/2026/04/Insight-181-The-Anatomy-of-the-Strait-of-Hormuz-Oil-Shock.pdf · Kpler: https://www.kpler.com/blog/middle-east-conflict---oil-market-implications-a-continuing-assessment · CRS R45281: https://www.congress.gov/crs-product/R45281 · Statista: https://www.statista.com/statistics/277157/key-figures-for-the-strait-of-hormuz/ · Britannica: https://www.britannica.com/topic/How-Much-Oil-Passes-Through-the-Strait-of-Hormuz · Wikipedia 2026 Hormuz crisis: https://en.wikipedia.org/wiki/2026_Strait_of_Hormuz_crisis · Wikipedia 2026 Iran war ceasefire: https://en.wikipedia.org/wiki/2026_Iran_war_ceasefire · CNBC 26 May: https://www.cnbc.com/2026/05/26/oil-prices-today-brent-wti-iran-trump-hormuz.html · CNBC 23 May: https://www.cnbc.com/2026/05/23/us-iran-war-talks.html · CNBC pipelines: https://www.cnbc.com/2026/03/12/strait-of-hormuz-oil-pipelines-iran-war-saudi-arabia-uae.html · CNBC alt routes: https://www.cnbc.com/2026/04/23/strait-hormuz-closure-alternative-routes-middle-east-oil-gas-pipelines.html · CNBC gas: https://www.cnbc.com/2026/03/03/middle-east-war-gas-energy-lng-drone-qatar-strait-hormuz-price-shock.html · Washington Post: https://www.washingtonpost.com/world/2026/05/24/us-iran-near-deal-extend-ceasefire-reopen-hormuz/ · CNN: https://www.cnn.com/2026/05/24/middleeast/iran-us-proposed-deal-wwk-intl · Al Jazeera UAE-OPEC: https://www.aljazeera.com/news/2026/4/29/uae-quits-opec-what-that-means-for-the-gulf-energy-markets-and-beyond · Al Jazeera violence: https://www.aljazeera.com/economy/2026/5/5/oil-prices-surge-as-violence-flares-in-strait-of-hormuz · Al Jazeera UAE pipeline: https://www.aljazeera.com/news/2026/5/15/uae-to-accelerate-oil-pipeline-project-to-bypass-hormuz · CNBC UAE-OPEC: https://www.cnbc.com/2026/04/28/uae-opec-oil-iran.html · Khaleej Times UAE-OPEC: https://www.khaleejtimes.com/uae/uae-announces-decision-to-withdraw-from-opec-opec-from-may-1 · Caixin insurance: https://www.caixinglobal.com/2026-03-07/war-risk-insurance-returns-to-strait-of-hormuz-at-a-price-102420420.html · Strauss Center: https://www.strausscenter.org/strait-of-hormuz-insurance-market/ · Khaleej Times shipping: https://www.khaleejtimes.com/world/strait-hormuz-reopening-shipping-costs-insurance-premiums · Safety4Sea: https://safety4sea.com/vlcc-insurance-jumps-as-freight-rates-escalate-due-to-tensions/ · Argus: https://www.argusmedia.com/en/news-and-insights/latest-market-news/2700387-awrp-tanker-insurance-to-jump-in-mideast-gulf · Pipeline Journal: https://www.pipeline-journal.net/news/saudi-arabia-maxes-out-east-west-pipeline-bypass-strait-hormuz · Wikipedia East–West pipeline: https://en.wikipedia.org/wiki/East%E2%80%93West_Crude_Oil_Pipeline · The Conversation: https://theconversation.com/what-alternatives-do-gulf-states-have-to-the-strait-of-hormuz-281805 · Capital.com (Barclays/UBS/STEO): https://capital.com/en-int/market-updates/crude-oil-price-forecast-19-05-2026 · Bloomberg Hormuz shock: https://www.bloomberg.com/graphics/2026-iran-war-hormuz-closure-oil-shock/ · German Economic Institute (IW): https://www.iwkoeln.de/en/studies/daniel-james-muncaster-why-the-2026-hormuz-crisis-may-not-enrich-the-gulf-and-what-that-means-for-germany.html · Arab Reform Initiative: https://www.arab-reform.net/publication/hormuz-under-fire-lng-disruption-regional-exposure-and-energy-sovereignty-in-mena/ · House of Commons Library CBP-10637: https://commonslibrary.parliament.uk/research-briefings/cbp-10637/ · INN Fed/gold: https://investingnews.com/federal-reserve-gold-price/ · CompressorTech² LNG: https://www.compressortech2.com/news/europe-asia-lng-prices-climb-on-hormuz-closure/8120248.article · LSE Business Review: https://blogs.lse.ac.uk/businessreview/2026/03/12/disruption-in-the-strait-of-hormuz-is-a-global-inflation-shipping-and-growth-story/