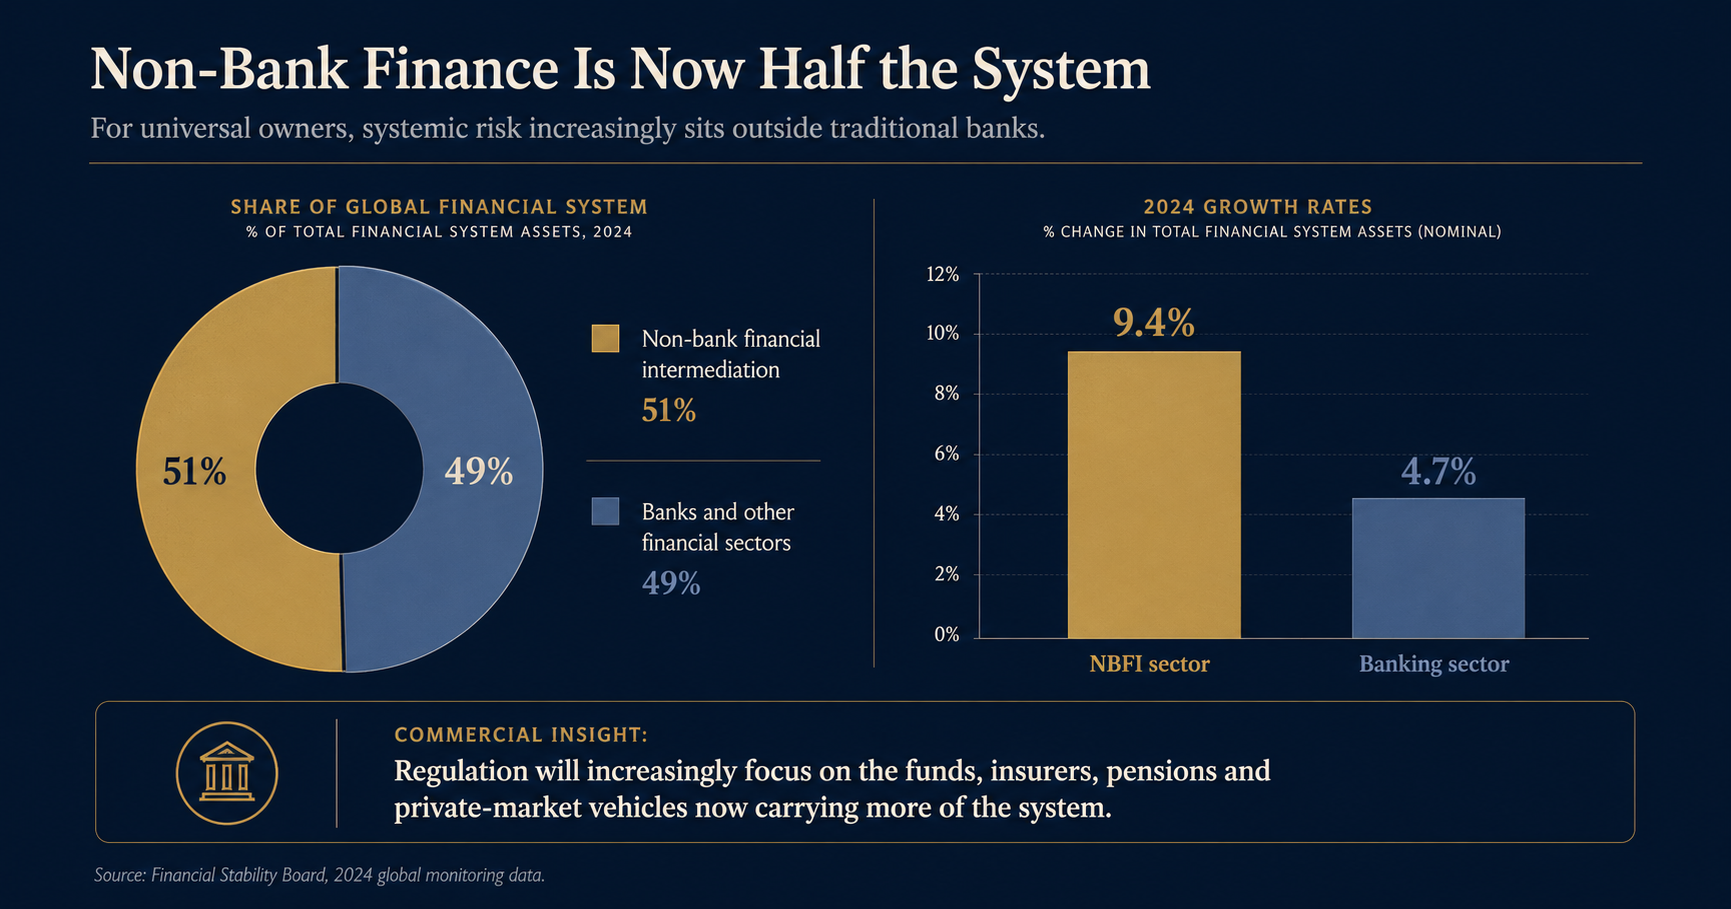
The Financial Stability Board reports that non-bank financial intermediation grew 9.4% in 2024, reaching $256.8T and rising to 51% of total global financial assets — overtaking banks and other financial sectors, which hold the remaining 49% and grew a slower 4.7% over the year.
Commercial insight
This is the regulatory map for the next decade. If more credit, liquidity transformation and leverage now sit outside banks, then private funds, insurers, pensions, asset managers and family offices will face greater scrutiny. Capital formation will increasingly require understanding not just return appetite, but regulatory perception — who is watching which exposures, and why.
Allocator insight
Universal owners are no longer merely allocating into markets. Through non-bank finance, they are increasingly part of the market structure regulators are watching. The question is whether your governance and reporting are built for that level of visibility.
Source: Financial Stability Board, Global Monitoring Report on Non-Bank Financial Intermediation (2024 data).